
Core Web Vitals have become an important metric to track for SEO. They’re at the heart of the algorithm updates this summer of 2021, as they become part of the ranking algorithm focusing on Page Experience for search.
What are Core Web Vitals?
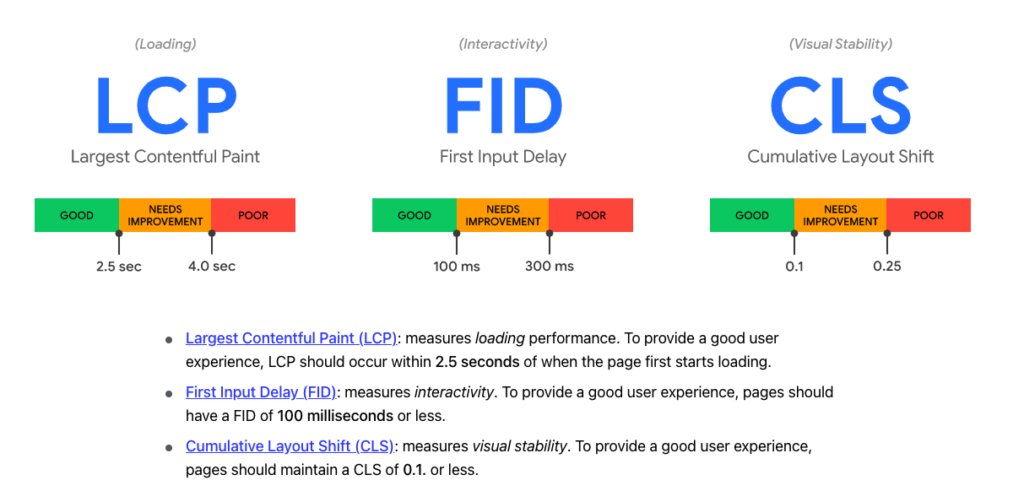
Let’s start with some context: what are Core Web Vitals? They’re currently three metrics defined by the web.dev initiative led by Google, that are used to quantitatively measure user experience on a web page:
- Largest contentful paint, which is essentially how long it takes the biggest element to load, and gives you a sense of load time
- First input delay, which is the time before user interaction like scrolling or clicking is recorded
- And Cumulative layout shift, which measures how much things move around as the page loads.
These are what we call field metrics, which means that they’re collected “in the field” or from real behavior of consenting Chrome users, aggregated across about a month of data.
In Oncrawl, you can look at how your site’s pages perform, or will perform on Core Web Vital metrics. So that you can get an instantaneous result for any web page, including those that aren’t visited or aren’t known to Google, we use lab data, or data measured when we run the test, rather than collected from real users.
Essentially this means that we replace the First Input Delay with Total Blocking Time, which estimates the time until the browser is available to process scrolls or clicks. This substitution is approved and recommended by Google.
To see how your site performs on Core Web Vitals, you’ll need to have run a Javascript crawl with Core Web Vitals included. You can set this up in the crawl settings.
Examining site-wide performance
We’re just going to go over how to use this dashboard to examine your CWV, and to prioritize work on web performance issues.
Here you have a site-wide overview of your website performance. This should look fairly familiar if you’ve ever run a Lighthouse or Pagespeed Experience Audit.
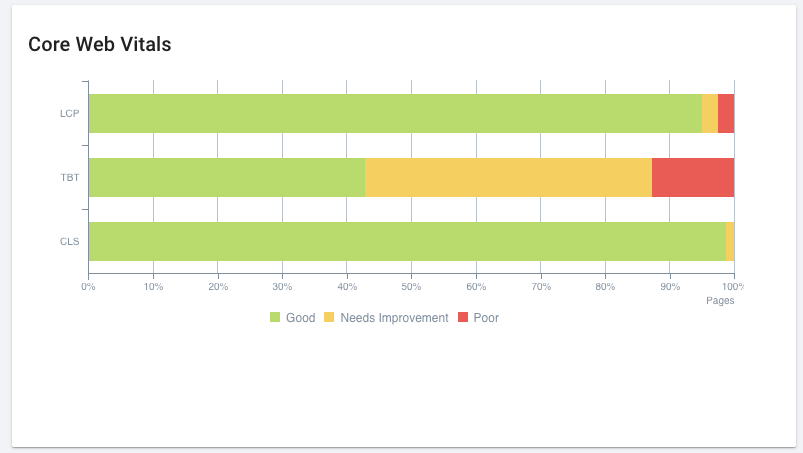
It looks like there’s room for improvement on this site’s Largest contentful paint, and some work to be done on the total blocking time, but the content layout shift is looking pretty good.
Based on this, let’s look deeper into what’s going on with the TBT.
Focusing on sections of the site
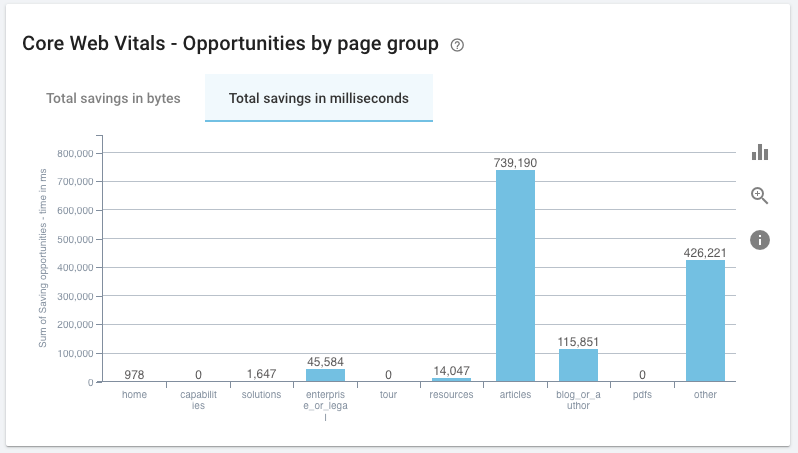
Further down the dashboard, we can see how performance breaks down, by CWV and by page group. It’s a good idea to make sure you’re using a segmentation that has meaning for the site you’re analyzing. For example, if you use page templates, segmenting by template can be useful.
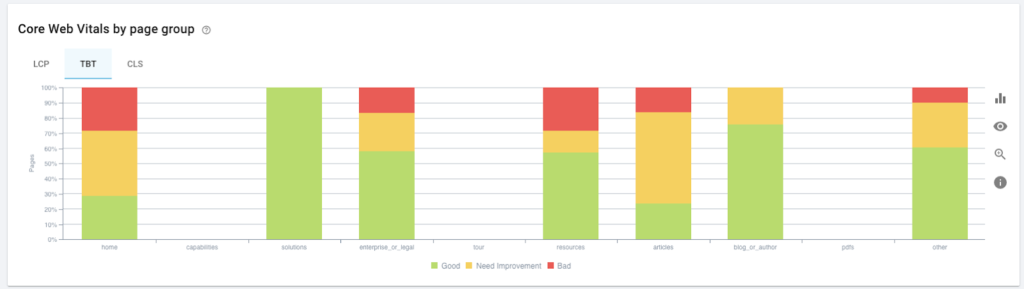
Some page groups will naturally be more important than others. I’m going to discount anything in the “other” group: these are pages that I’ve neglected to classify in my segmentation. So right out the door, I know they’re not really where I want to concentrate my efforts unless they’re egregiously bad.
Similarly, the “enterprise or legal” group on this site are pages I want crawled as far as branding is concerned–about me, contact, terms of service–but that I’m not particularly concerned about ranking for at the moment.
In other words, I’ll probably want to concentrate on resources and articles.
We’ll keep that in mind and head back up the page.
[Case Study] Managing Google’s bot crawling

Understanding the potential impact of improvements
This dashboard also helps us target areas where we can make the most impactful improvements, based on the suggested optimizations and associated savings reported by Lighthouse. These aren’t always practical or even globally advisable optimizations, but looking at the estimated savings gives you a good quantitative measure of how much you can improve.
If I look at the possible savings in resources and articles, it’s pretty clear that I’ll want to be focusing on the articles: that’s where I can potentially make a significant difference on the site, whether we’re looking at bytes that can be saved, or switching tabs and concentrating on on milliseconds that we can shave off the loading time, which is more important for TBT.
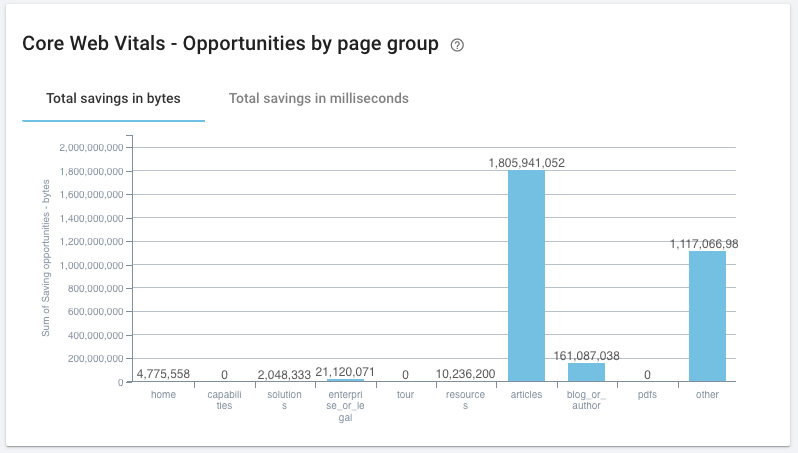
If I focus only on the articles by changing the base filter applied to the dashboard, this corresponds to about 1.8 million bytes or 770ms per page, for nearly a thousand pages.
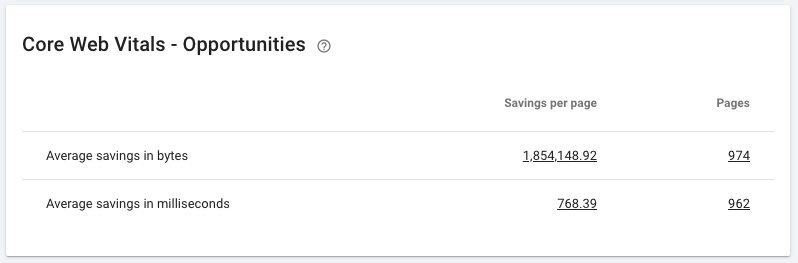
In deciding whether or not to go ahead with any optimisations, this can be a huge factor. I might not have the resources to cover a thousand pages one by one, but fortunately on this site, I know that the articles use a template. I can probably make changes on that level that will affect all of these pages at once. So that will likely be a good place to start.
Understanding the impact of Core Web Vitals on SEO performance
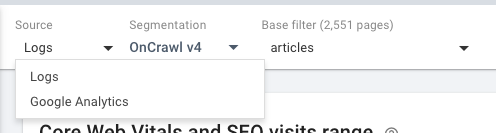
Now that we have an idealized view of the core web vitals on the site, it’s a good idea to measure the actual impact on organic traffic and search engine bot behavior. This can help you prove or disprove your SEO hypotheses regarding what has an impact of your SEO. If you have log analysis or any analytics account connected to Oncrawl, we merge this data and do the analysis for you. We’ll head over to the SEO Impact report.
We’re going to look at data drawn from log file analysis because I’m going to want to take a look at bot behavior, but you can switch to data drawn from analytics instead. Regardless of which source you use, you should see essentially the same if not identical trends.
There’s no clear relationship between the Total block time and the number of organic visits my articles receive–this is pretty even across the board–, nor the pages that receive visits and those that don’t. That’s a good sign so far.
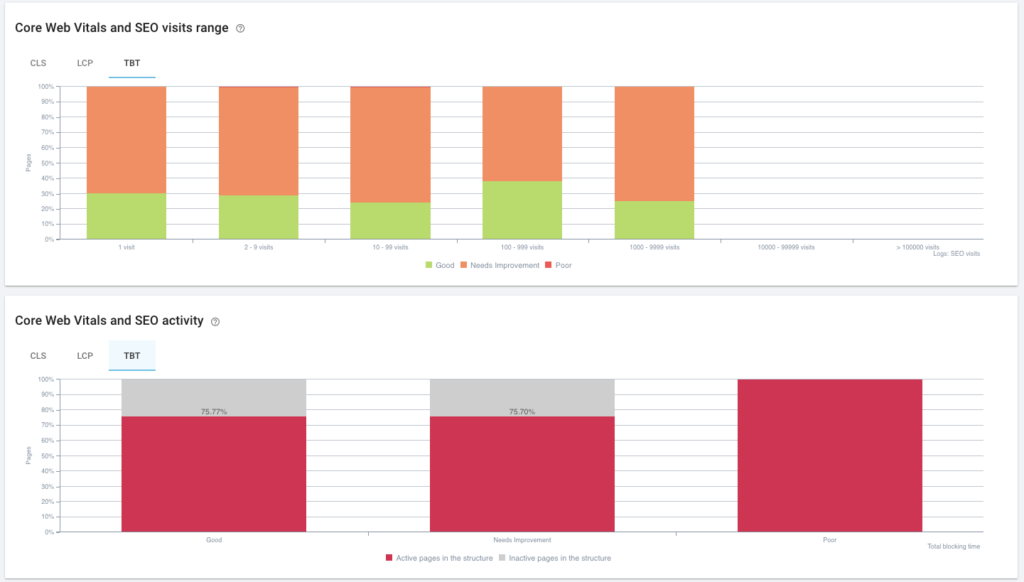
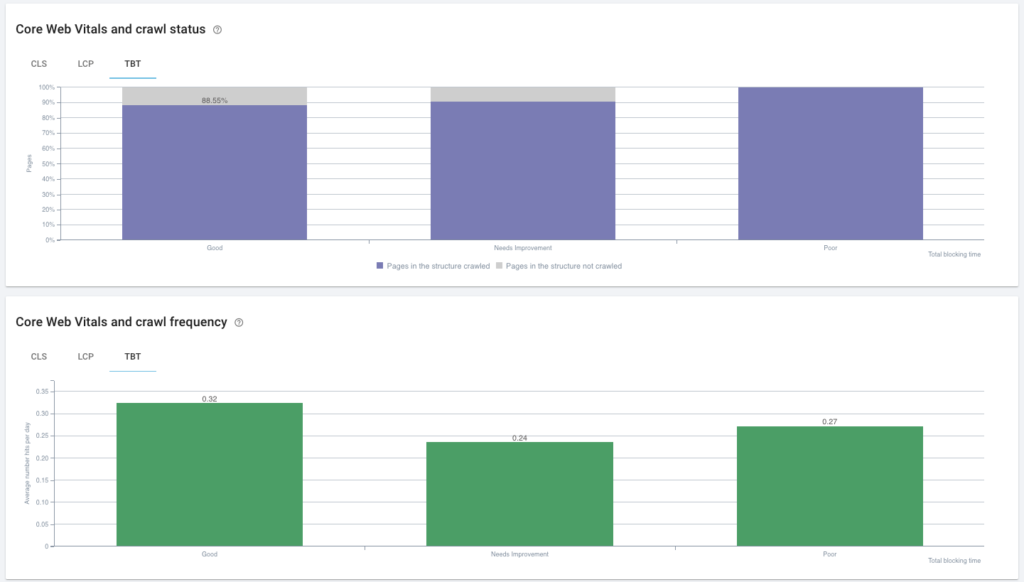
Now let’s look at bot behavior. There’s no significant difference between TBT scores in terms of whether a page is crawled or not. It looks like there’s a big drop here in crawl frequency between “good” and “needs improvement” pages, but it’s not significant.
Checking any anomalies
However, in scrolling, I did see that there’s a big difference in correlation between the crawl frequencies of pages with a good and a poor Content Layout Shift score. So I’m just going to take a second to investigate a little further. The site performs really well on this metric, so the “poor” group here shouldn’t contain too many articles. I just want to make sure they’re not priority content.
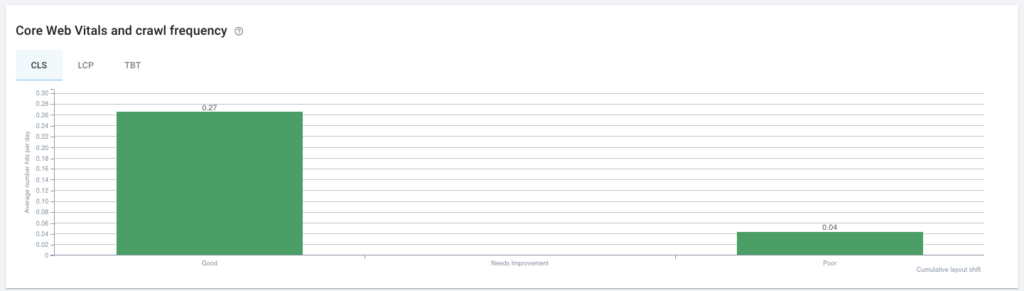
By clicking on this part of the graph, I can see the URLs–and in this case there’s only one. It’s a product update, so depending on my product marketing strategy, I might want to go take a closer look at this particular page if I really need it to rank well.
What’s next for Core Web Vitals?
Keep in mind that this update hasn’t fully rolled out yet at the time we wrote this. You may want to come back and look at changes in how CWV affect your site in a month or two. One way to do this would be to create a segmentation based on ranges–Good, Needs Improvement, or Poor–of Core Web Value scores, and use a crawl over crawl to examine the differences between groups of pages from one crawl to the next. But more on that another time.
Now you know one way to explore a Core Web Vitals audit with Oncrawl!