How to take advantage of advanced Oncrawl features to improve your efficiency during daily SEO monitoring.
Oncrawl is a powerful SEO tool that helps you monitor and optimize search engine’s visibility of e-commerce websites, online publishers or applications. The tool has been built around one simple principle: help traffic managers save time in their analysis process and in their daily SEO project management.
Besides being an onsite audit tool, based on a SaaS platform supported by an API combining all websites data, it is also a log analyzer that simplifies data extraction and analysis from log server files.
Oncrawl’s possibilities are quite wide but need to be mastered. In this article, we’re going to share 5 time-saving tips for your daily use of our SEO crawler and log analyzer.
1# How to categorize HTTP and HTTPS urls
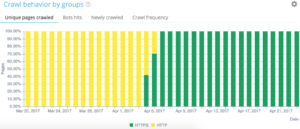
HTTPS migration is a hot topic in the SEO sphere. To perfectly handle this key step, it’s important to precisely follow bots behavior on both protocols.
Experience has shown that bots take more or less time to completely switch from HTTP to HTTPS. On average, that transition takes a few weeks or months, depending on external and internal factors related to site’s quality and migration.
To precisely understand that transition phase, where your crawl budget is heavily impacted, it is clever to monitor bots hits. It is thus necessary to analyse server logs. The bot, as a regular user, leaves marks on every page, resource and request he makes. Your logs own the ports that have delivered these calls. You are thus able to validate your HTTPS website’s migration quality.
Methods to set up a dedicated http vs https set of page group
On your Advanced project home, you can find on the upper right corner a “settings” button. Then, select the “Configure Page Group” menu. Once here, create a new “Create Group Set” and name it “HTTP vs HTTPS”.
In order to access your logs, it is important to select the “I want to use this set on log monitoring and cross analysis dashboards” option.
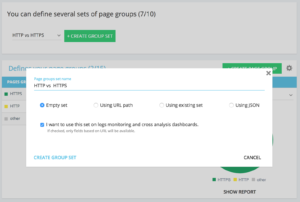
- HTTPS : “Full url” / “start with” / https
- HTTP : “Full url” / “not start with” / https
Once saved, you will access a view of your HTTPS migration (if you have added the request port in your log lines. You can have a look at our guide.)
Our QuickFilters can be found in the Data Explorer. They’ve been built to ease the access to some important SEO metrics such as links pointing to 404, 500 or 301/302, too slow or too poor pages, etc.
Here is the complete list:
- 404 errors
- 5xx errors
- Active pages
- Active pages not crawled by Google
- Active pages with status code encountered by Google different than 200
- Canonical not matching
- Canonical not set
- Indexable pages
- No indexable pages
- Orphan active pages
- Orphan pages
- Pages crawled by Google
- Pages crawled by Google and Oncrawl
- Pages in the structure not crawled by Google
- Pages pointing to 3xx errors
- Pages pointing to 4xx errors
- Pages pointing to 5xx errors
- Pages with bad h1
- Pages with bad h2
- Pages with bad meta description
- Pages with bad title
- Pages with HTML duplication issues
- Pages with less than 10 inlinks
- Redirect 3xx
- Too Heavy Pages
- Too Slow Pages
But sometimes, these QuickFilters don’t answer all your business concerns. In that case, you can start from one of them and create your “Own Filter” by adding pieces in the filter and by saving them to quickly find your filters whenever you connect to the tool.
For instance, from links pointing to 4xx, you can choose to filter links that have an empty anchor : “Anchor“ / “is” / “” and save that filter. Once saved, it can be modify as many time as needed.
You now have directly access to that particular “Quickfilter” in the “Select a Quickfilter” list at the bottom of the “Own” part as seen on the below screenshot.
3# How to set up DataLayer-related Custom Fields?
You may use a segmentation of your related types of pages when you define your analytics tools tags for instance. That particular code is very interesting to segment or cross data from Oncrawl with your external data.
To let you create a “pivotal column” for your analysis, we can extract these pieces of codes during crawls and bring them back as a type of data of your project.
The “Custom Fields” option enables to scrape any element from the source code pages thanks to a regex or a XPath. These languages have their own definition and rules. You can find information about XPath here and about regex here.
Use case 1: extracting the datalayer data from the pages source code
Code to analyse:

Solution : Use a “regex” : s.prop2=”([^”]+)” / Extract : Mono-value / Field Format : Value

- Find the s.prop2=” character string
- Scrape all characters that are not “ (the first character following the data to extract)
- The string to extract can be found before the closing “
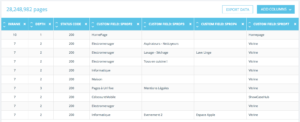
Following the crawl, in the data explorer, you will find in the sProp2, sProp3 column or in your field Name, the extracted data:
Use a XPATH
Code to analyse:

You just need to copy/paste the Xpath element you want to scrape directly from the Chrome code analyzer. Be careful, if the code is rendered in JavaScript, you will need to setup a custom scrape project. The Xpath language is very powerful and can be hard to manipulate so if you need some help, please call our experts.
Use case 3: testing an analytics tag presence during a reception phase
Use a regex
Code to analyse:

Solution : Use a “regex” : ’_setAccount’, ‘UA-364863-11’ / Extract : Check if exist
You will get in the Data Explorer a “true” if the string is found, “false” on the contrary.
4# How to visualize the Google crawl frequency on each part of your website
Crawl budget is at the heart of any SEO concern. It is deeply linked to the “Page Importance” concept and to Google’s crawl scheduling. We know these principles, introduced in the Google patent since 2012, let the Mountain View society optimize resources dedicated to the web crawl.
Google does not spend the same energy on every part of your website. Its crawl frequency on each part of your website gives you precise insights about your pages’ importance to Google’s eyes.
Important pages are more crawled by Google bots because the crawl budget is deeply linked to a page ranking skills.
The Oncrawl Advanced projects let you natively see the crawl budget in the “Log monitoring” / “Crawl Behavior” / “Crawl Behavior By Group” part.
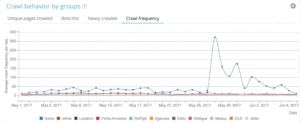
You can see that the “Home Page” group has the highest crawl frequency. It’s normal because Google is constantly looking for new articles and they are generally listed on the home page. The Page Importance idea is deeply related to the Google Freshness concept. Your home page is the most important page to prioritize your Google crawl budget. Then, the optimization is spread to other pages regarding depth and popularity.
It is however hard the see frequency differences. You thus need to click on the groups you want to remove (by clicking on the legend) and see the data show up.
5# How to test status codes from a list of URLs after a migration
When you want to quickly test status codes from a set of URLs, it is possible to modify the settings of a new crawl:
- Add all the start URLs (“add start url” button)
- Define max depth to 1
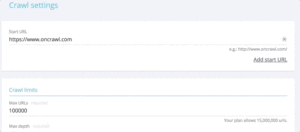
This custom crawl will return qualitative data regarding this url set.
You will be able to check if redirections are well setup or follow the status codes evolution over time. Think about the advantage of crawling regularly, you will be able to automatically follow old urls.
Why don’t you create an automatized dashboard via our API and create automatized test monitoring on these aspects.
We hope these hacks will help you improve your efficiency using Oncrawl. We still have many advanced tricks to show you. Please share with us on Twitter your #oncrawlhacks for instance, we’re glad our users can have as much fun as we have with our tool.
