Oncrawl’s log monitoring lets you track metrics for four major search engines: Google, Bing, Baidu and Yandex. While monitoring for Google is included in all log monitoring accounts by default, you can easily add additional search engines by reaching out to us through the in-app chat.
All metrics are available for all four search engines. By default, most graphs display data from a single search engine at a time. You can switch between search engines using the “Bot” drop-down menu at the top of all log monitoring pages.
How to gain insights from comparing trends in search engine crawls
Each search engine crawls websites based on the search engine’s available resources and its “crawl budget”. In this case, I’m using the term “crawl budget” to refer to the importance — or the “budget” measured in time and number of bot hits — that a search engine is willing to accord a website.
Furthermore, search engines operate based on their own schedules: they may experience peaks in traffic at different times or seasons due to the different time zones or markets that they address; they also evolve at their own rates, which means that new features and algorithm updates that can cause changes in crawl behavior for Bing won’t necessarily happen at the same time as those for Google.
However, the search engine ecosystem is not the only factor that can influence crawl budget. Outside events that cause a peak in search activity across search engines, or on-site changes such as major content updates, significant SEO changes or even server outages, can provoke temporary changes in behavior on multiple search engines.
Being able to attribute changes in crawl behavior and crawl budget to the search engine versus to market- or to website-based elements can help you catch both on-site errors and behavioral shifts on your market.
One of the best ways to do this is to compare trends in search engine crawl behavior. Even a superficial, visual check can quickly separate global events — like server issues — from search-engine-specific elements — like too-aggressive robots.txt changes that target a single search engine.
Why doesn’t Oncrawl show all search engine activity on a single chart?
If the ability to spot-check visual trends in crawl behavior is so important, why do most Oncrawl charts show a single search engine at a time?
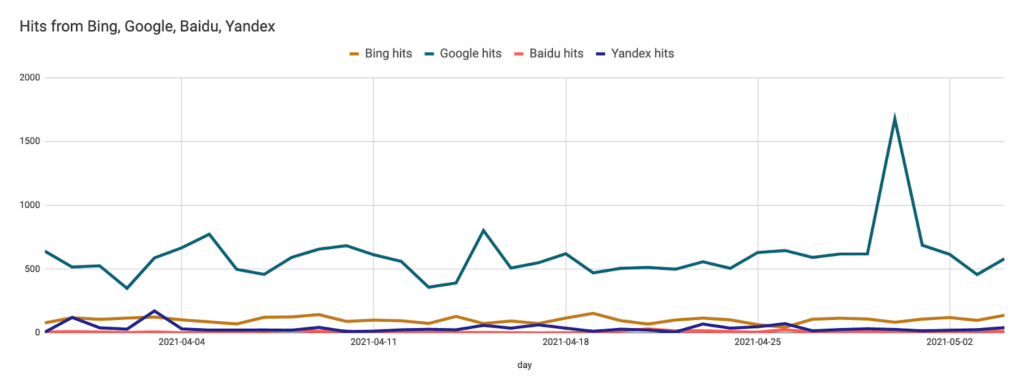
The answer is readability. For many sites, search engine traffic is dominated by a single search engine. In these cases, this can skew the scale and make it impossible to spot trends in other search engines.
Here’s an example of what that can look like. Despite daily hits from Baidu, this site’s focus on Google makes it nearly impossible to identify patterns in Baidu hits:
The solution: custom dashboards
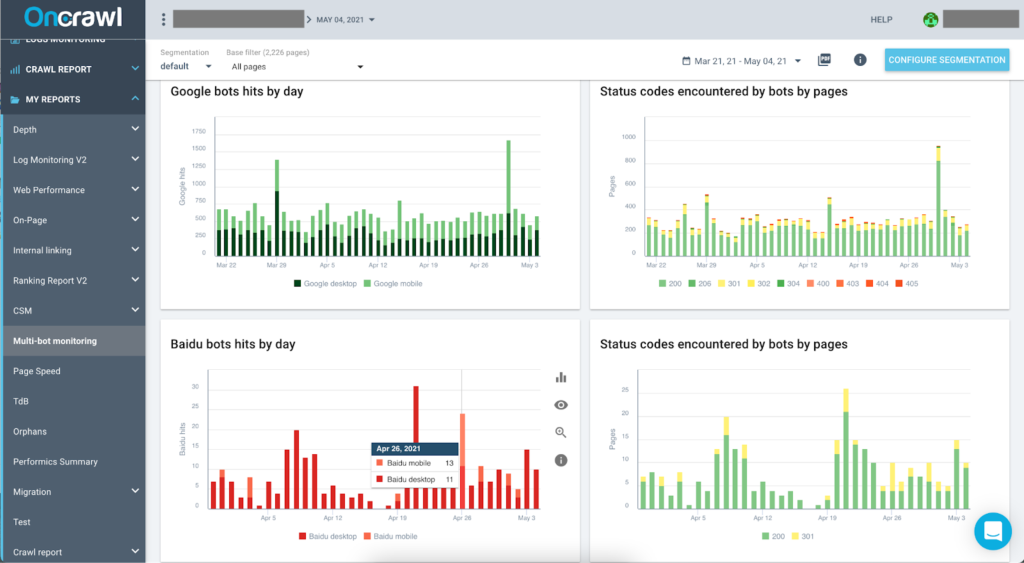
What we can do instead of viewing all search engines on a single chart is to view all of the search engines in their own charts, but on a single dashboard.
For this, we’ll be using Oncrawl’s Dashboard Builder, which lets you combine any charts from all of the Oncrawl reports, in any order, to create your own dashboard.
Creating the dashboard
First, we’ll create a custom dashboard. From any report, open the Tools menu in the left-hand sidebar and select the Dashboard Builder. You’ll automatically start out with a blank dashboard, and you can go ahead and start adding charts.
To find a chart, the easiest thing to do is to search for it, then to scroll through the results, which are grouped by type of data. Charts are listed by their name.
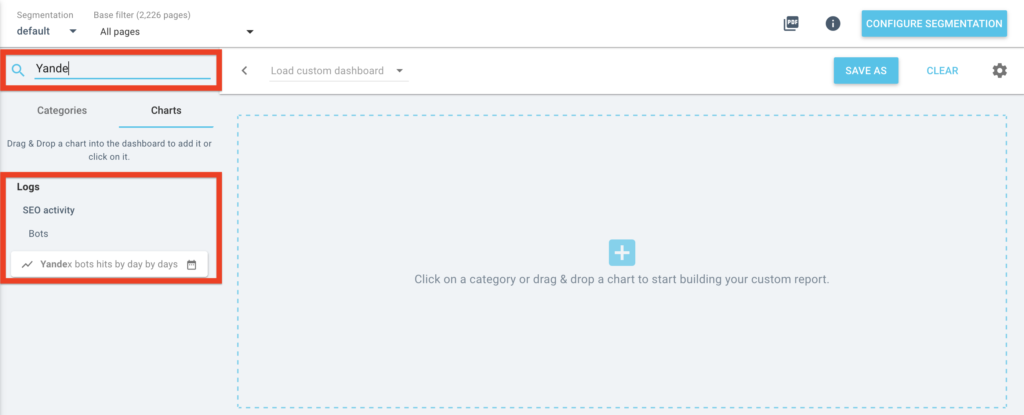
Let’s focus on crawl behavior first. The main crawl behavior chart can be found by searching for the name of the search engine we’re interested in.
Add the chart to your dashboard by dragging and dropping it wherever you want.
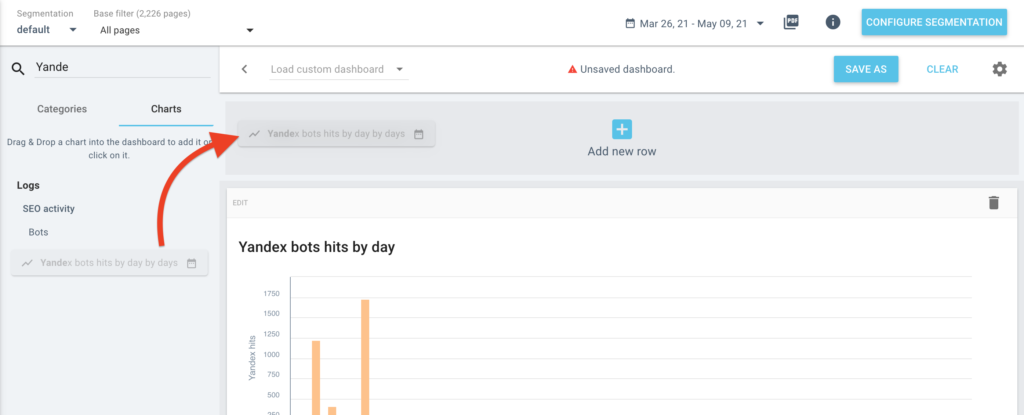
I prefer to create a separate row for each search engine.
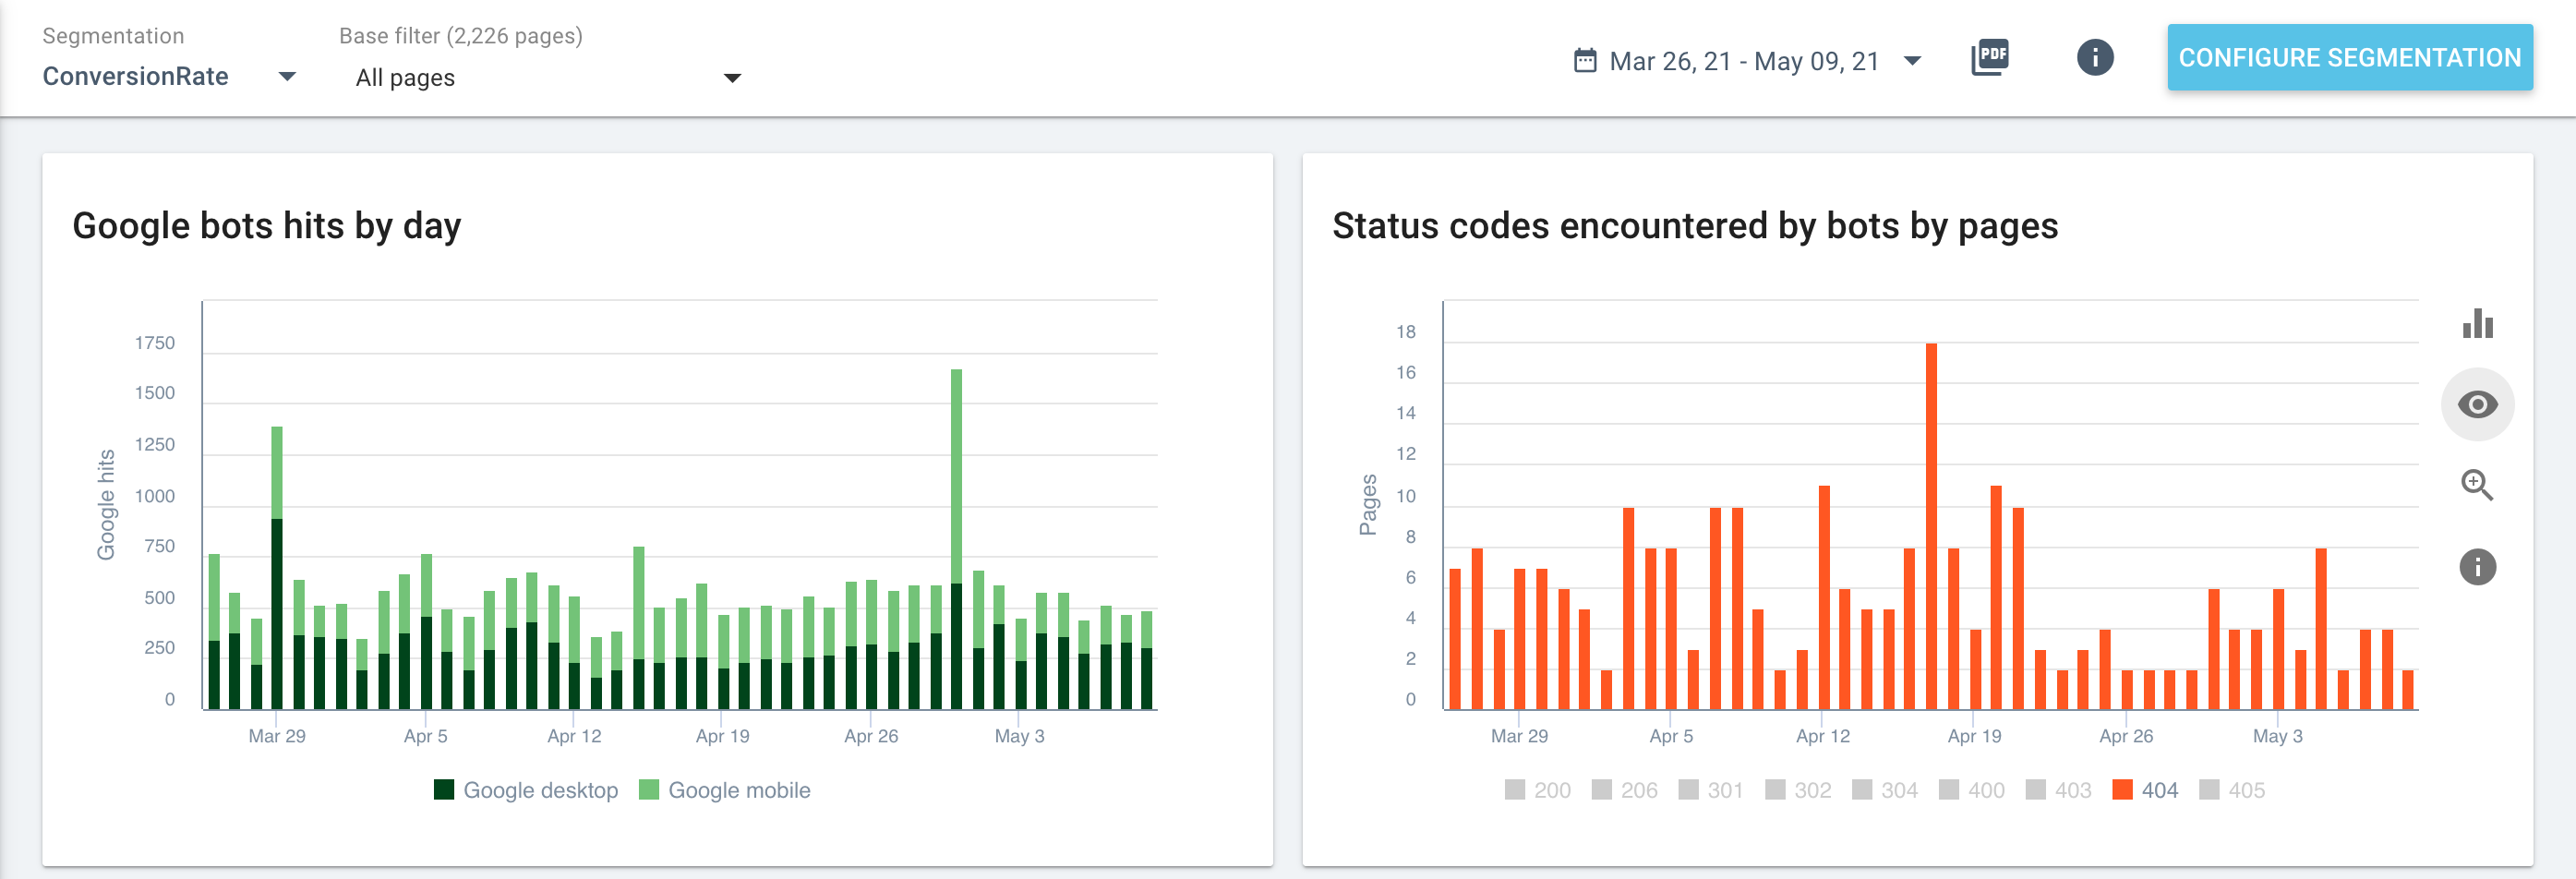
Since we’re trying to differentiate between search engine trends and website issues (like server problems), it’s also a good idea to look at the status codes of responses to bot requests per day and per page on your site. If drops in crawl activity across search engines correspond to peaks in 5xx or 4xx responses, you can be fairly certain of your diagnosis.
First, add one copy of the “Status codes encountered by bots by pages by days” chart to each row.
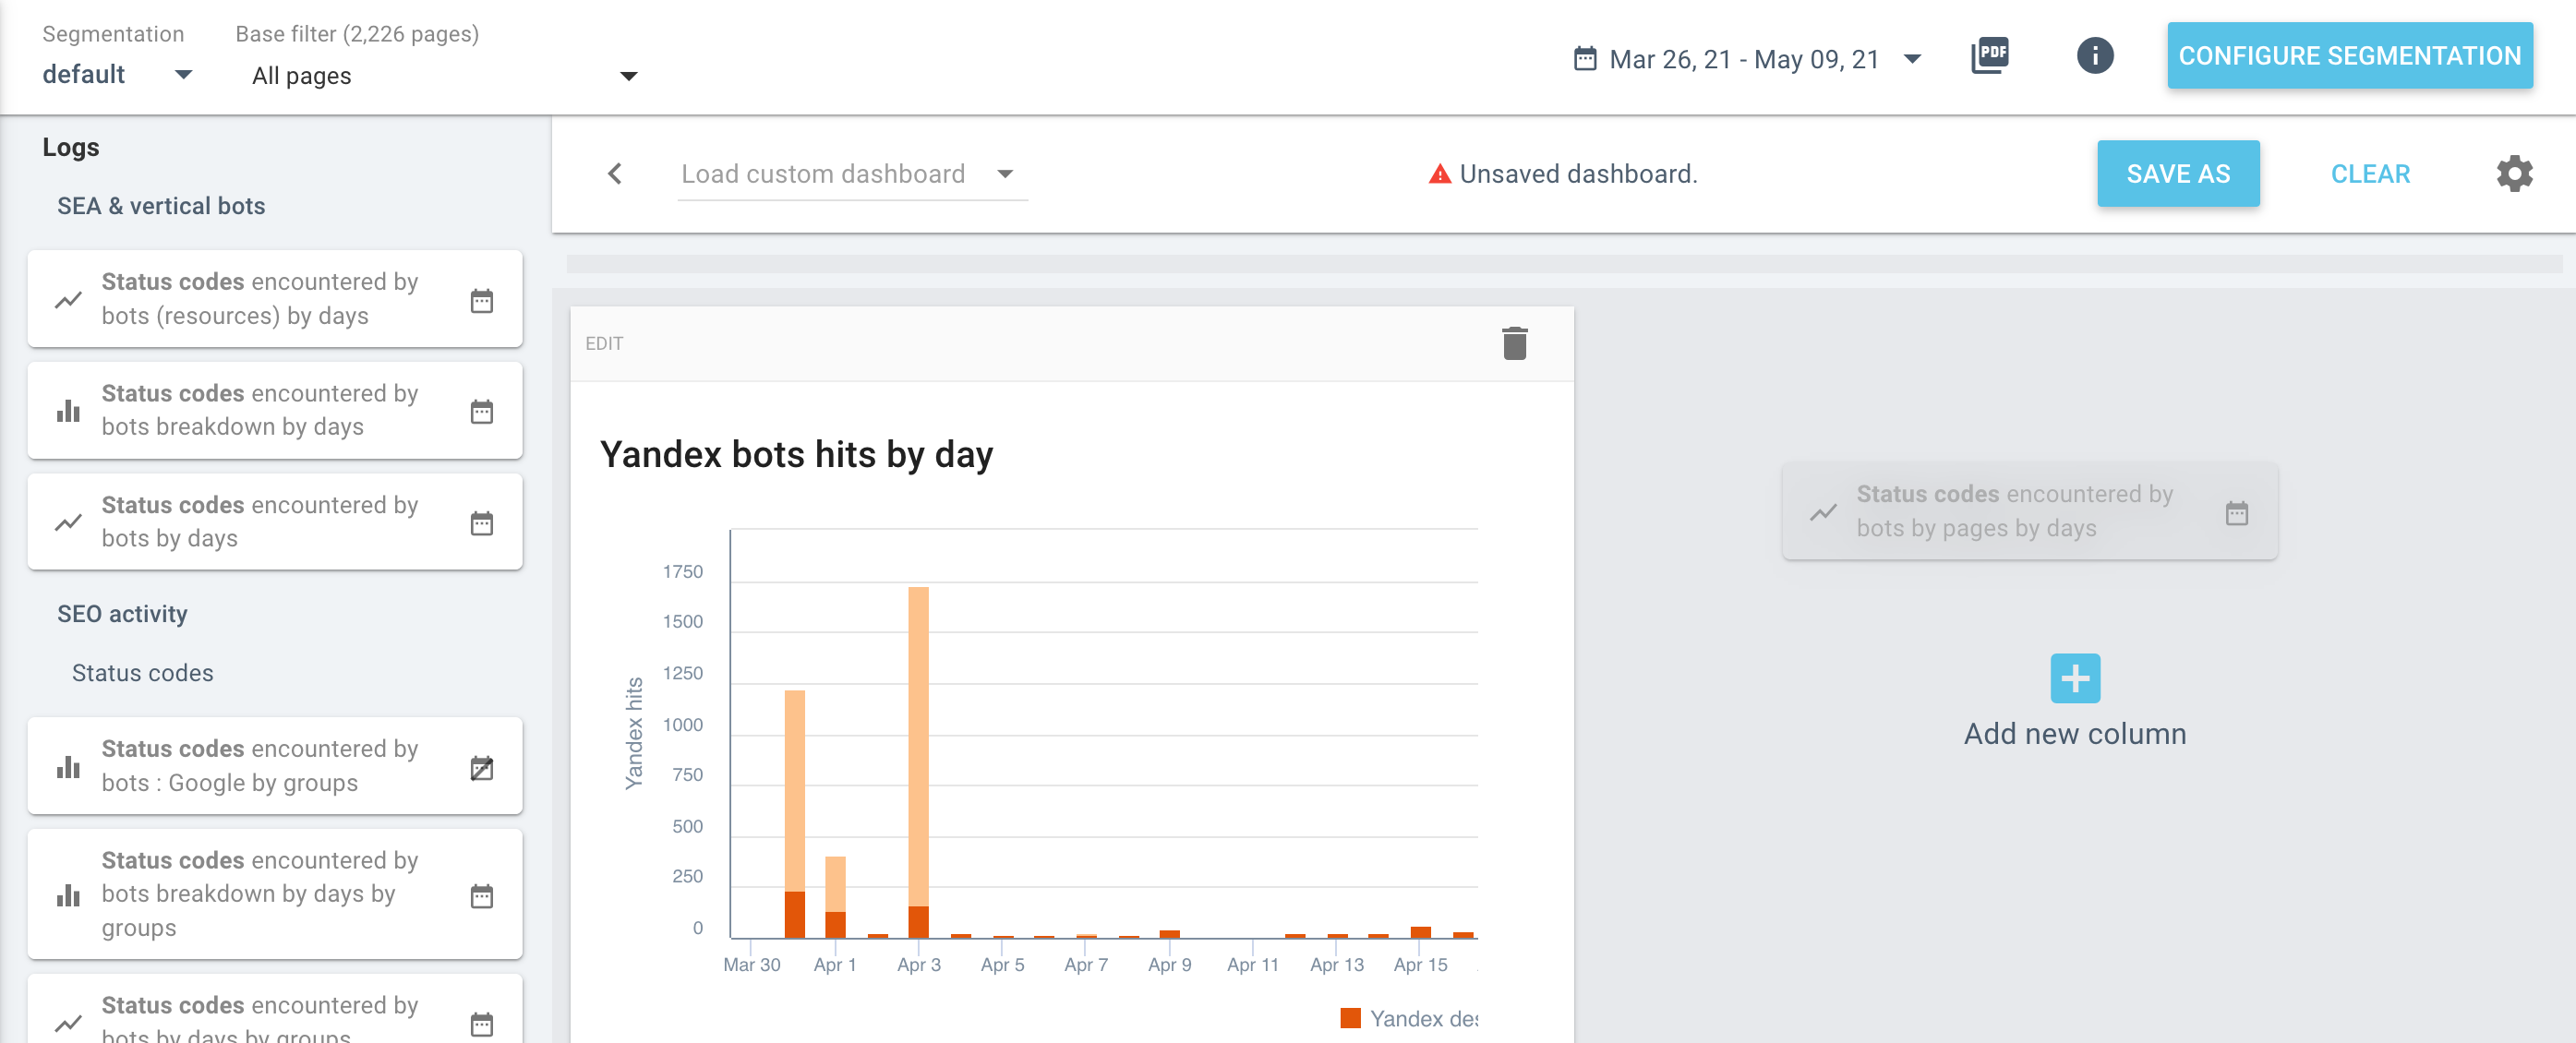
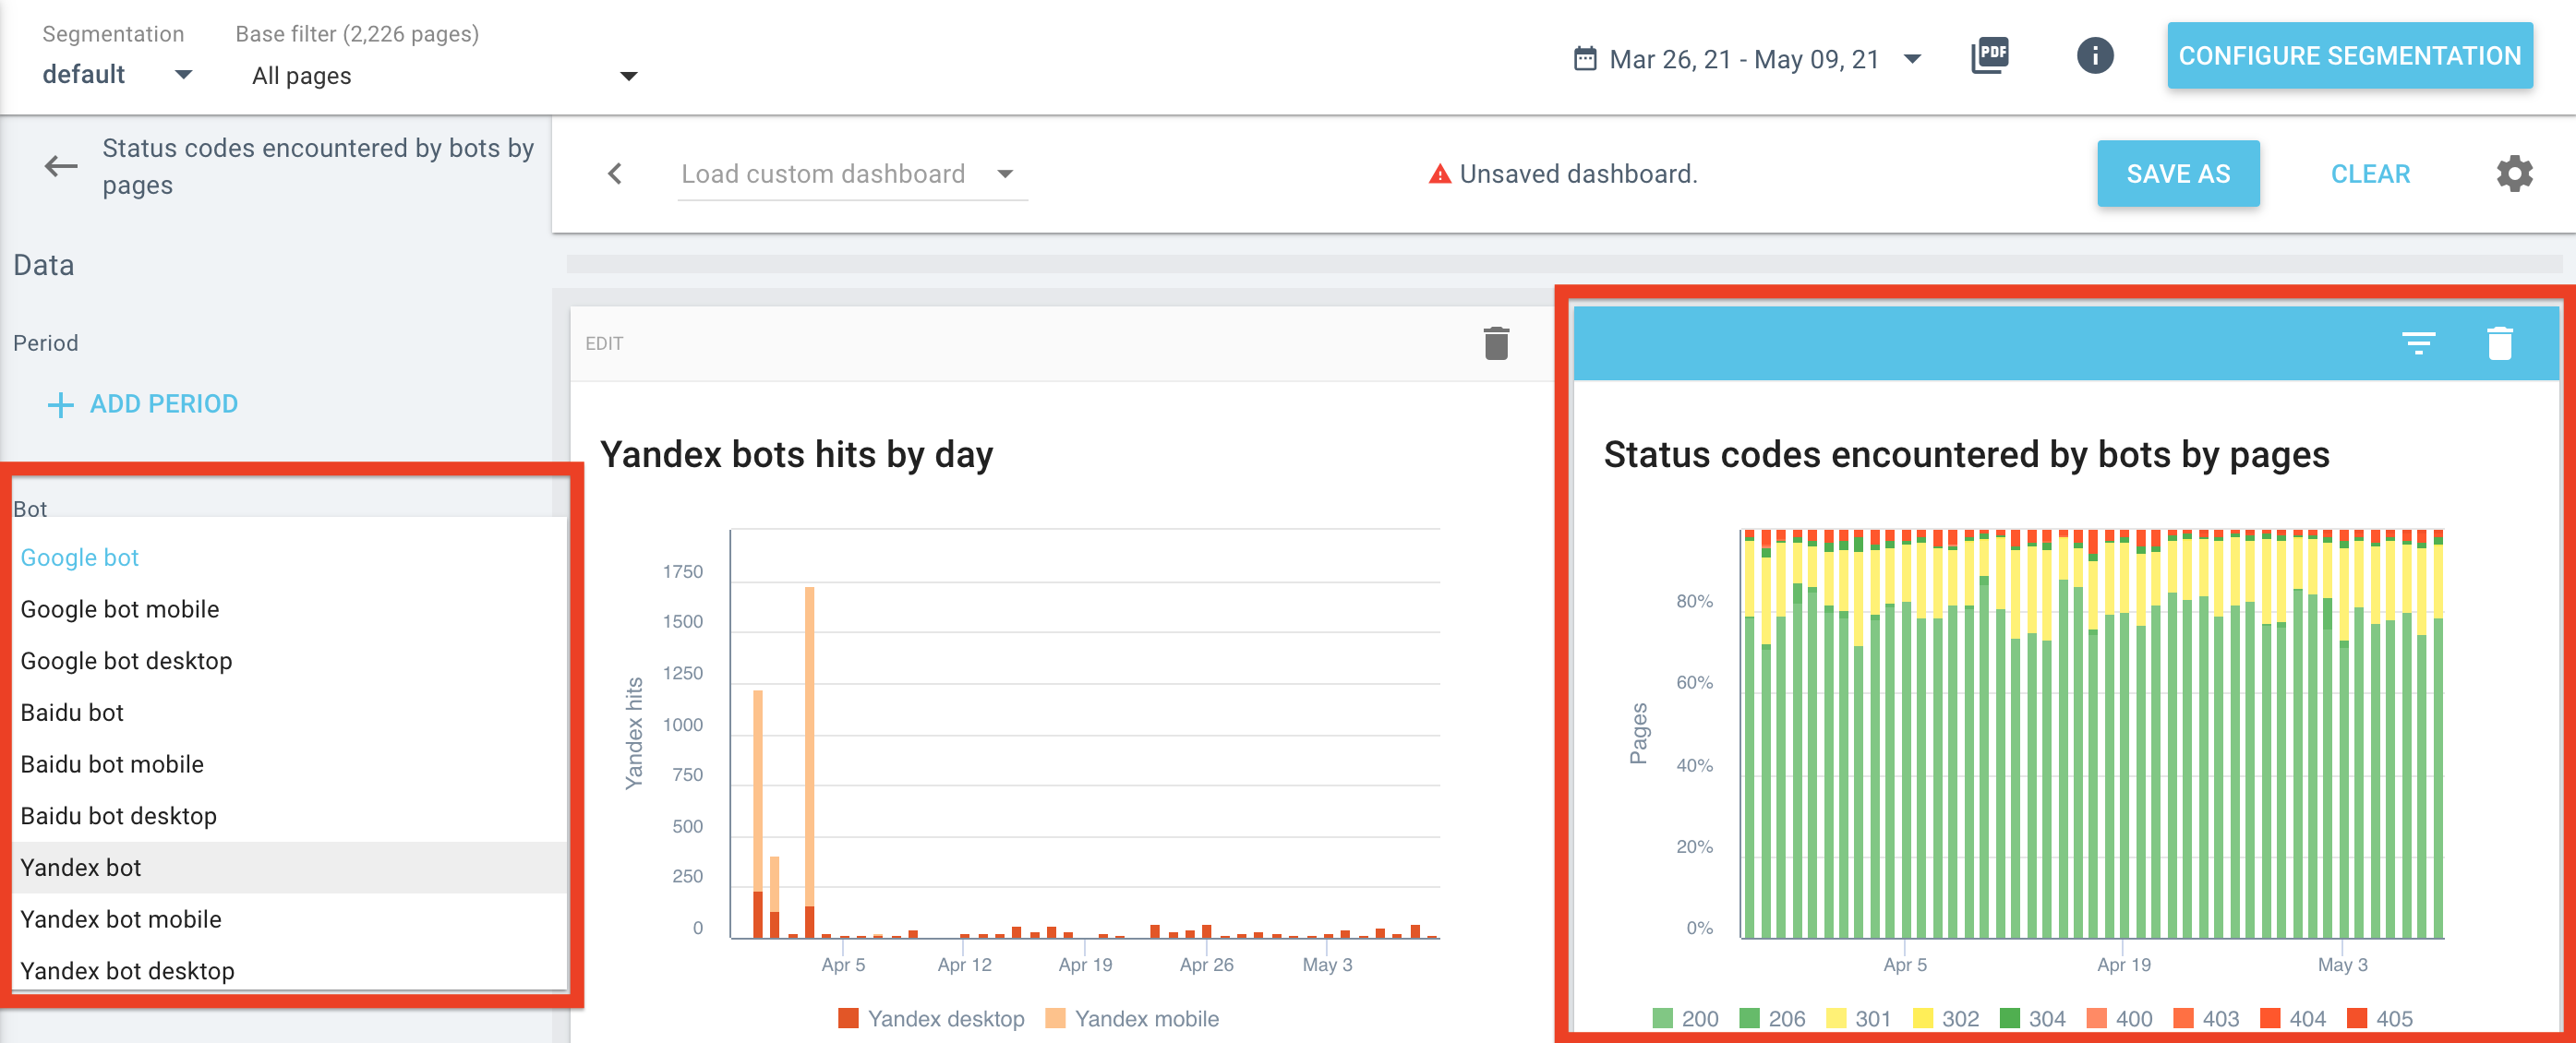
Now we’re going to edit the information shown in each chart, to limit them to the bots we’re interested in for that row.
Click on the chart you want to edit, then select the bot to filter for:
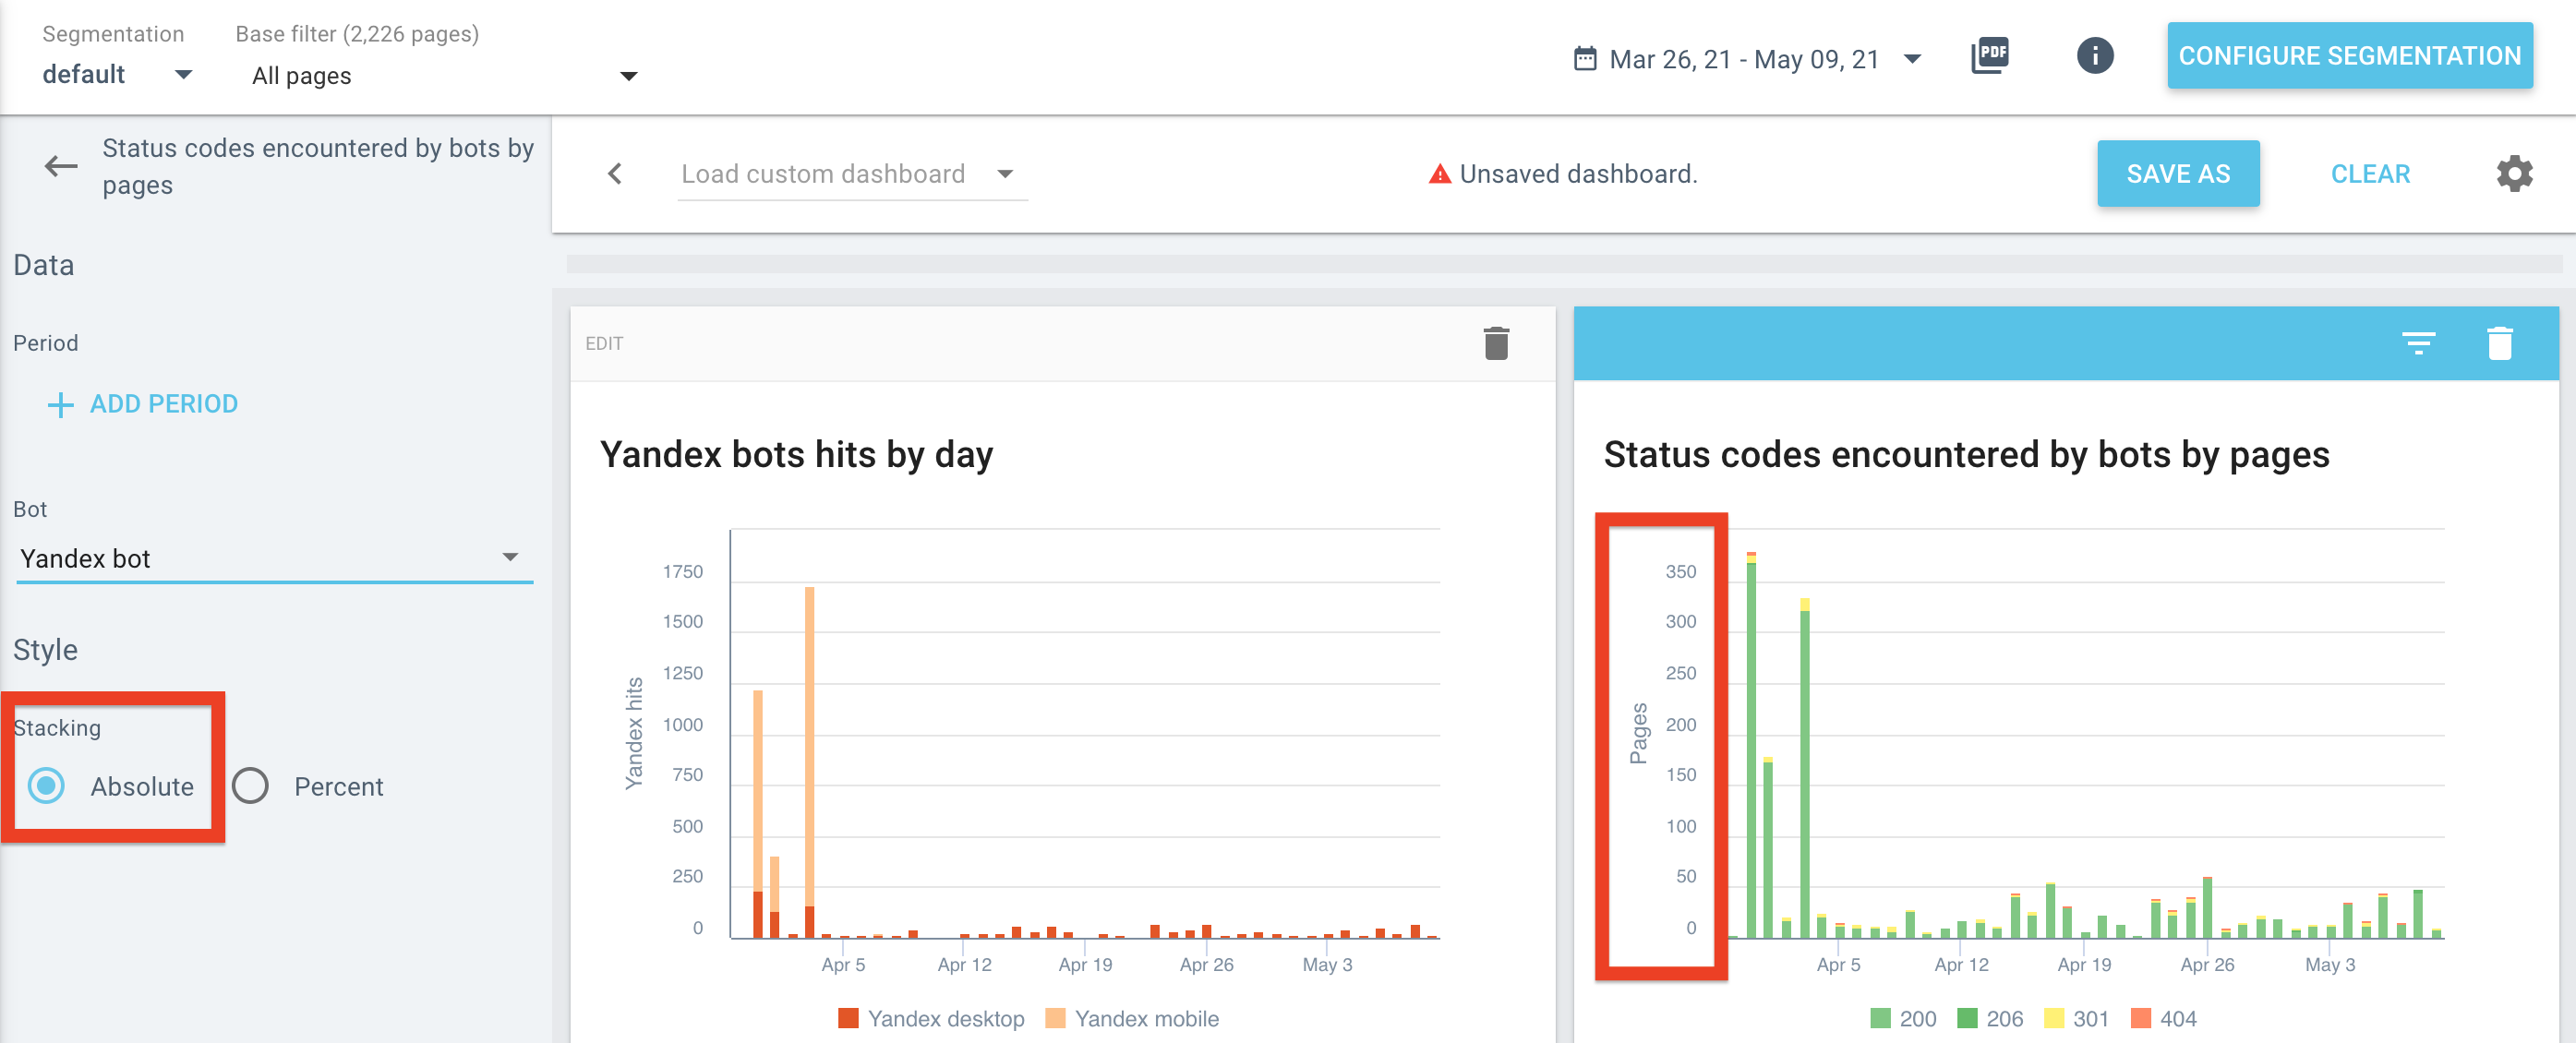
I also prefer to set the scale of the Y-axis (the vertical one) to absolute values rather than percentages:
Reading the dashboard
Once a custom dashboard has been saved, it will be available for any analysis in the project under “My Reports” in the left-hand sidebar.

When reading this dashboard, there are two things we should concentrate on:
- First, do a visual control of the trends in search engine behavior, in the bot hits per day charts on the left.
- Second, adjust HTTP status code responses to bot requests in the charts on the right to view only errors to check for peaks and correspondences.
Using this multi-search engine dashboard in your own projects
If you liked this dashboard and want to play around with it, or if you want to use it as-is in your own projects, you can download it for free here.
To upload it to your own project, follow these instructions:
- From the project home page, click on “Manage custom dashboards”
- Drop the JSON file you just downloaded in the “Upload” zone at the top left.
