There is an extremely narrow relationship between page resource order and the load time of a page, particularly compared to other page speed elements. Specifically, the perception of page load speed and the loading of the part of the page above the fold are largely related to resource order.
To create a positive initial contact with users and to decrease the time consumed by the largest contentful paint, we need to understand how resource order can impact your performance score.

Note that there is no green (TTFB, or time to first byte) portion, because this is a waterfall example from my computer, not from a server. White sections are waiting for connection, blue is for downloading and grey is for “stalling”.
This is the final article of a series of four articles about page speed on modern websites. For a better understanding of some of the topics that will be discussed in this article, you may want to read the earlier articles first:
- How does a Browser create a web page?
- Advanced Page Speed Metrics
- Optimizing Rendering of Javascript Assets
What this article will cover
In this article, within the scope of technical SEO, we will examine how the sequence of resources affects the stages of creation of the page. We’ll look at questions touching on ideas we’ve explored in previous articles, such as:
- What types of JS files should you place at the top of your page?
- Why does the complex array of CSS and JS files cause browsers to load the page more slowly?
- What resource load tips can you use to increase your page speed?
- What are the concepts of Cumulative Layout Shifting, Total Block Time and Largest Contentful Paint that Google has recently integrated into the Pagespeed Algorithm?
- Can resource order affect your crawl budget?
- Preconnect or DNS-Prefetch: which one is better for page speed?
- Are there harmful side effects of using async or defer attributes for JS sources?
Why look at resource order?

In the example above, one CSS file was extending the CSSOM process by simply overlapping the data produced by another. Also, the first file was adding some important visual style effects to large page elements. So getting the CSS file that affected the page more significantly before other resources created a relief for the DOMContentLoaded event.
For a news or e-commerce site with millions of URLs, this difference can create a significant gain and and a big difference in SEO performance over a year.
What are resource loading preferences?
An IT team should follow the same method when optimizing for different page speed metrics, including:
- Total Blocked Time
- Largest Contentful Paint
- Critical Rendering Path
- Resource Load Order
Any technical SEO who needs to guide their customers or in-house IT teams should know these techniques or the method.
Why is this important? Let’s look at an example:
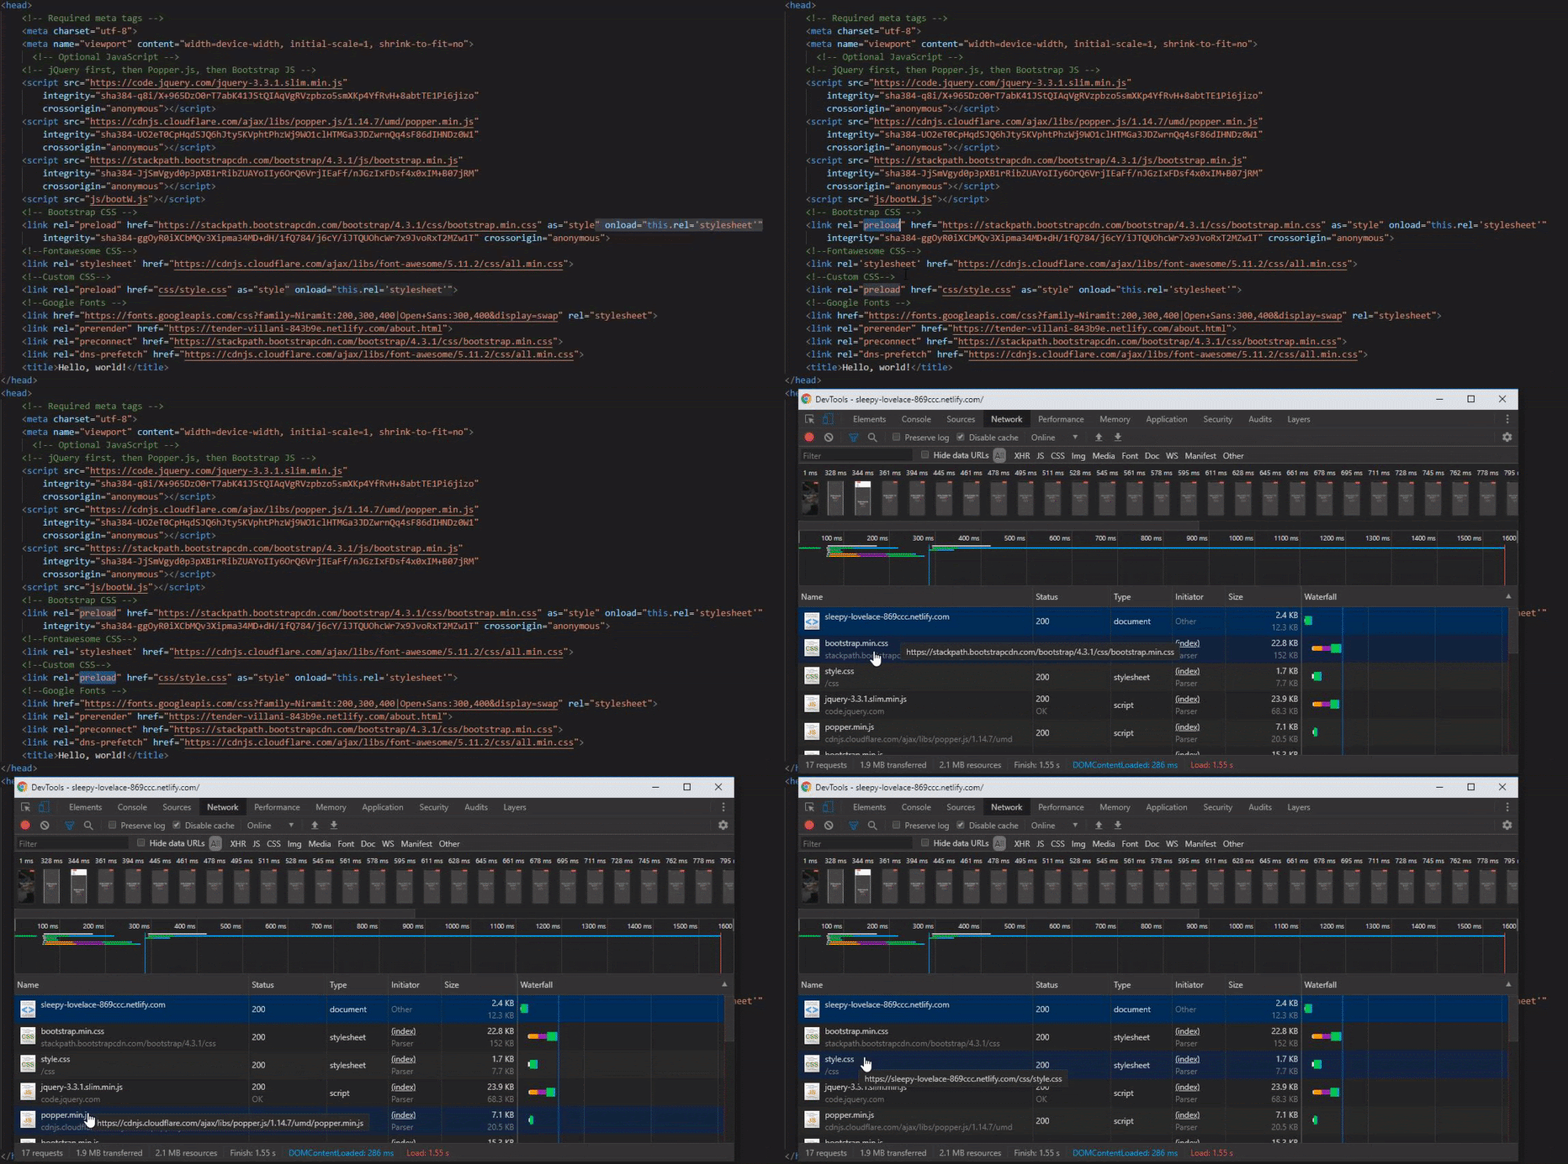
In this example, all important CSS files loaded after JS files using a preload attribute. In the waterfall, you can see that the browser loaded them first despite the requested resource order/priority. You will find a schema for this example below.
So far, we’ve looked at how the Document Object Model, the Cascaded Stylesheet Object Model, the rendering tree, and JavaScript are processed. We’ve seen the effects along with some modern page speed and UX metrics such as LCP, TBT, and CLS for optimizing the critical rendering path and the resource order/load.
However, we also need to know about load priority priorities, hints and commands.
We will use them, along with an understanding of different DOM types, to create the fastest critical rendering path.
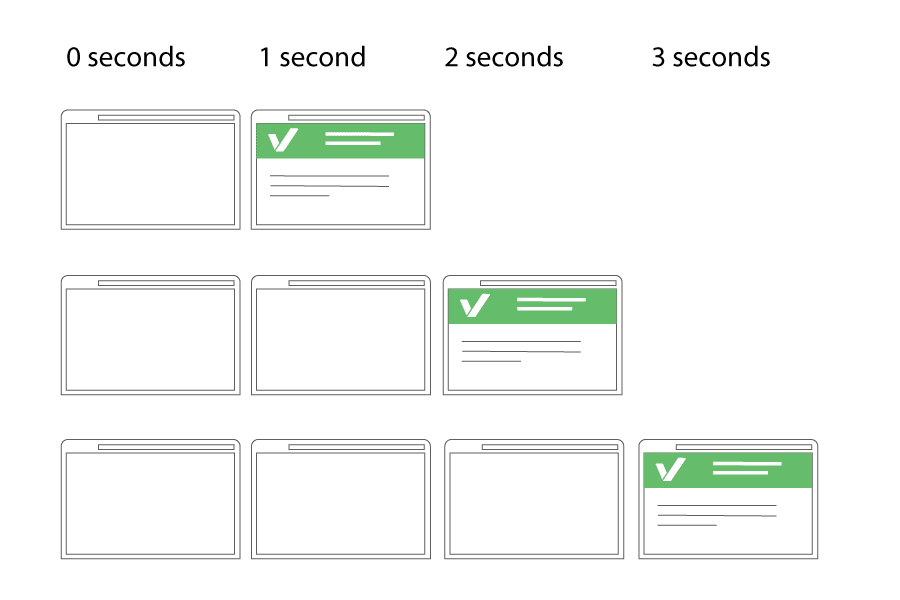
With the right resource syntax, you can offer the same size and number of resources to the user in less time for more conversion. Image Source: Varvy.
Resource Hints: Where to use, how to use, reasons to use or reasons to not use
Some of the prebrowsing or resource hints are preload, prefetch, preconnect, DNS-Prefetch, prerender.
Prefetch
Prefetch is a resource hint to download some important assets for the next pages without starting a session on them.
It is a low priority resource hint. This means that some modern browsers may not even listen to this hint.
Also, it caches the prefetched source in the browser memory. When the user clicks the next navigation, it instantly shows the prefetched resource and downloads the rest of the page resources later.
Note that you shouldn’t start prefetching during the runtime process or you may slow down the current page’s download and construction.
Example code: <link rel=”prefetch” href=”https://example.com/next-page.” />
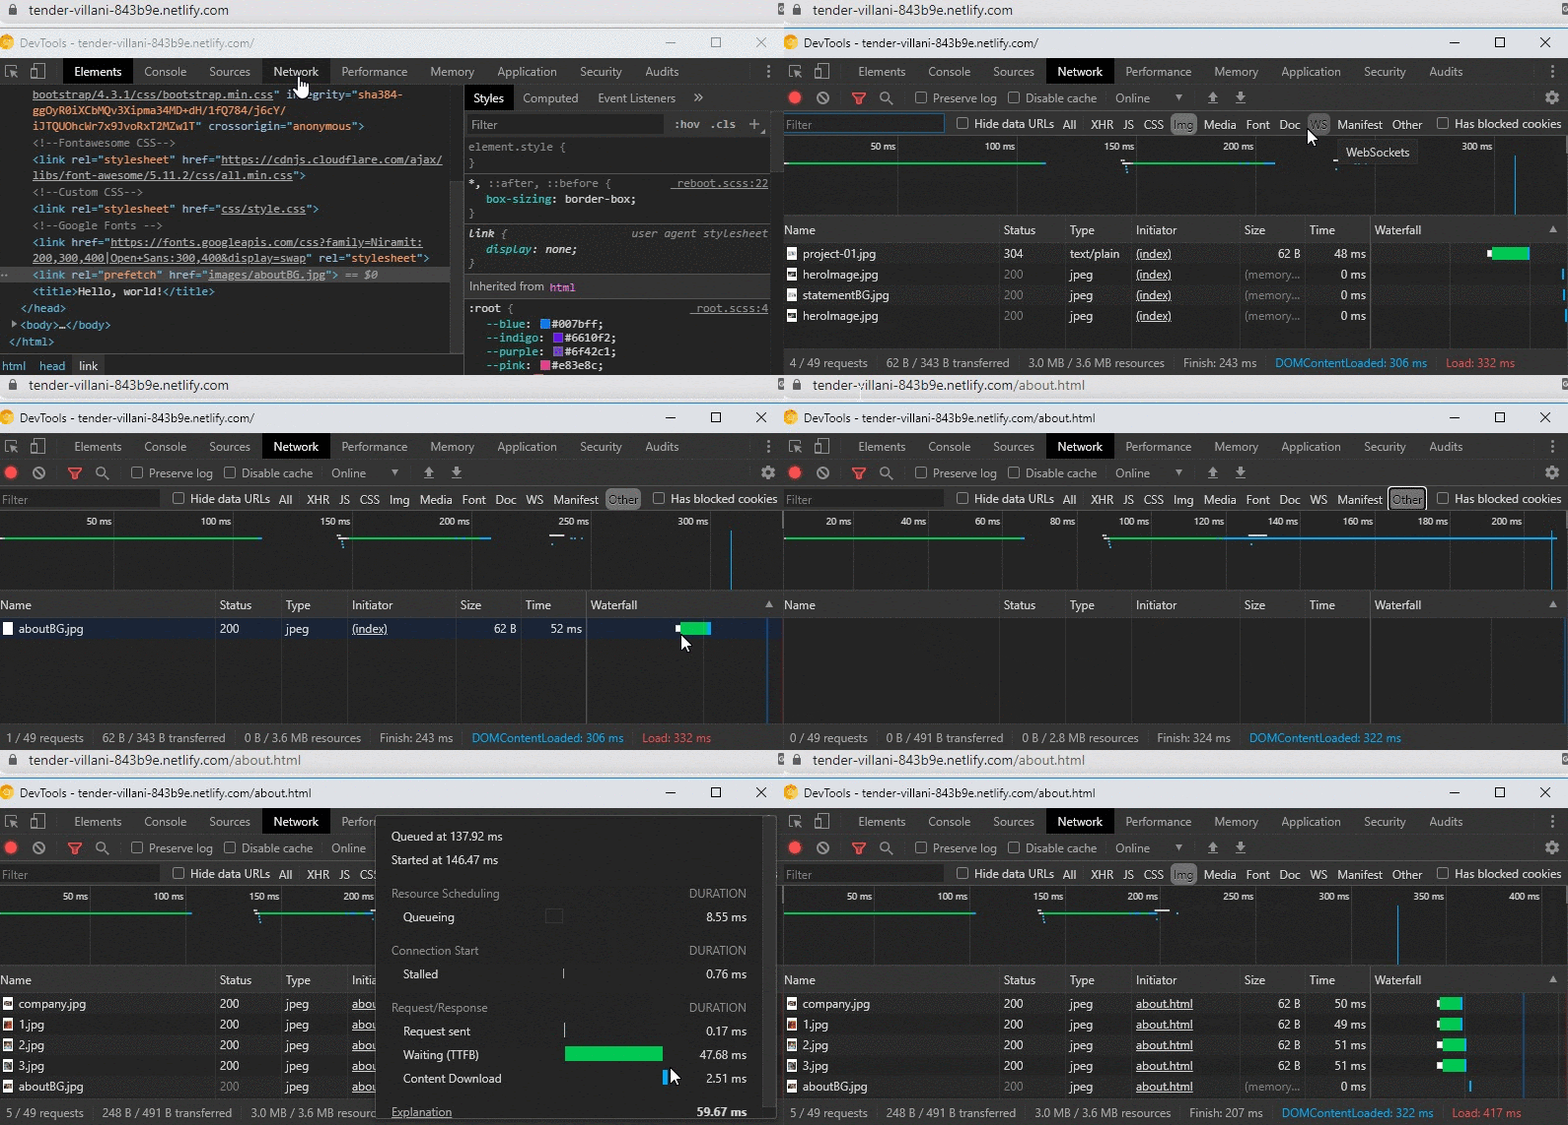
In the example above, the source “aboutBG.jpg” is “prefetch”. Moving on to the next page, we therefore see that the source prefetch with 0 MS and 0 WTTFB is loaded from the “memory” section. Therefore, “aboutBG.jpg” does not have any green (Time for First Byte) value.
You can see the prefetch sources from the Other section.
Prerender
Preender is a little bit different than prefetch. It basically downloads all of the next navigational web page with all the resources in the background. When a user clicks the next page, the browser shows it immediately.
If you use this feature, you have to delay it until the existing page is finished being rendered by the browser. You will also need to use Google Analytics or Guess.js to predict the next page in the user journey.
If you make a browser prerender or prefetch for the wrong next-navigational pages, you will probably make the user’s phone/desktop download everything for nothing.
Example code: <link rel=”prerender” href=”https://example.com/next-page.” />
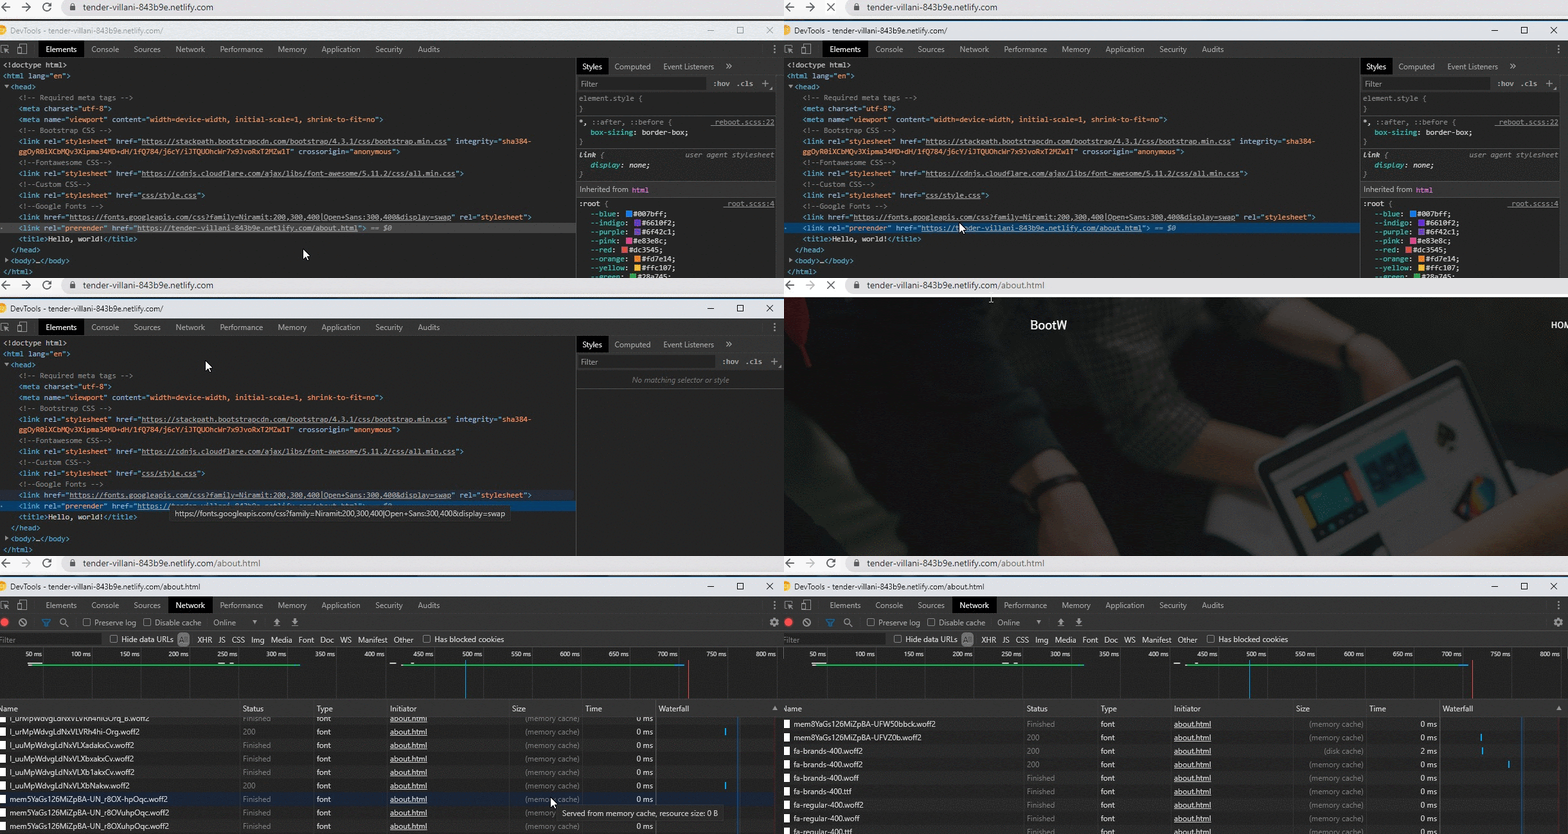
As you may notice above, all resources are cached before the page opens. Some of the resources were cached at 95% instead of 100%, but this did not interfere with the instantaneous loading experience.
Google announced a library called Guess.js at the 2018 I/O. Guess.js is integrated with Google Analytics, mapping users’ conversion / click journeys, and extracting “predictive navigation” paths. This allows you to use prefetch or prerender options with high predictive navigation value.
Note that Google Chrome and Firefox turn off prerender settings for the user in some cases (source: https://guess-js.github.io/).

This is an example of a click journey that users are likely to perform, mapped by Guess.js. As a Technical SEO, you can recommend that your developer teams incorporate the experiential results of this kind of technology.
You can also start logging your network events via Chromium on your PC. Visit “chrome://net-export/” and start logging for future prerender or prefetch events in your browser. This way, you can examine your daily web journey.

DNS-Prefetch and Preconnect
DNS-Prefetch and Preconnect are both very similar and different resource hints.
DNS-Prefetch is only for DNS Reverse Lookup. It means that it is used to try to find the domain addresses of external resources in advance.
On the other hand, preconnect is not only used to find DNS/domain addresses. It also finishes the TLS Negotiation and TCP Handshake processes for encrypted content. In the light of this difference, using Preconnect is better than just DNS-Prefetch.
Example code:
- <link rel=”preconnect” href=”//example.com”>
- <link rel=”dns-prefetch” href=”//example.com”>

You can test your TTFB with the Webpagetest waterfall as above. When you use Preconnect, you will see a 10-20 MS speed increase for TTFB and initial connection. You also should use standard deviation for these kinds of unstable test topics. This way, you will report a more certain result to your developer team.
You may also want to use this tool to test DomInteractive. Below is a more detailed TTFB examination for the same resource:
![]()
![]()
Preload
The main difference between Preload and Preconnect is that Preload also downloads the resource. If you have important resources for the critical rendering path, you should also think about using the Preload option on them.
This creates a response header according to resource type, which is another minor advantage for page speed.

Above, you can see an important point: Firefox doesn’t support Preload hints by default. It supports it under the “network.preload” if the user has changed the browser’s default settings.
Example code: <link rel=”preload” href=”example-big.png”> or <link rel=”preload” href=”example.css” as=”style” onload=”this.rel=’stylesheet’”>
You should modify “as” and “onload” parts according to your resource (“as=”media”, as=”script” etc…).
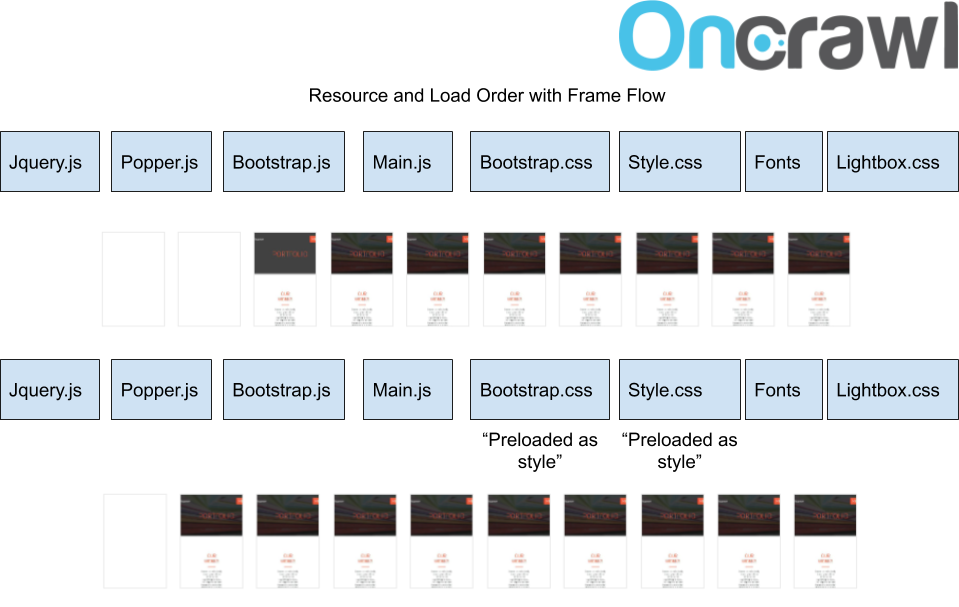
Here we can see that although CSS files were placed after Javascripts during loading, the initial contact time was improved by more than 15% by “preloading” the important ones.
Further improvement will appear if unnecessary CSS code is removed and if CSS for the section above the fold is provided inline. However, if requests for “Total Blocked Time” are not too long, inline CSS will not make a significant contribution for requests under 50 MS.
The impact of Resource Request Count and Size
Although this article is mainly about resource order and load priority hints, the effect of the relationship the count and size of resource order requests on one hand and page speed and crawl budget on the other should be addressed before wrapping up.
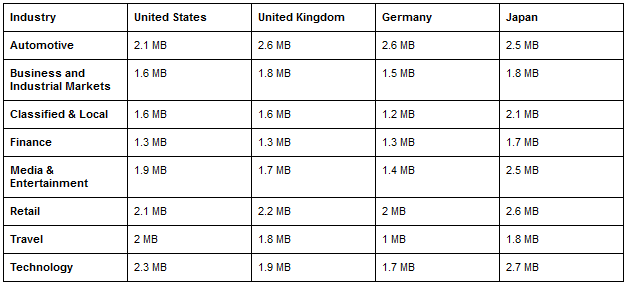
These are the average web page sizes according to sectors and countries:
These are the average web page resource counts according to sectors and countries.
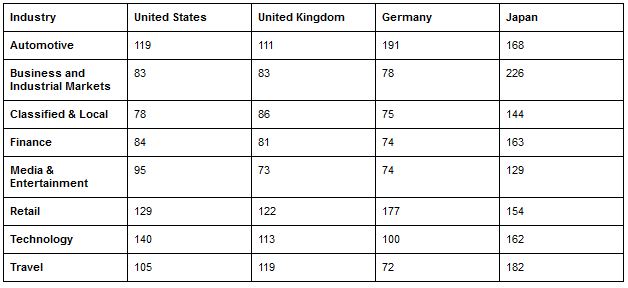
Geographical differences in this form are largely due to the differentiation of developer traditions. However, in countries with a low internet quota limit per capita, such as in Japan, it is interesting to see pages that are too large and make too many requests.

Automatic Page Speed test via Google Sheets and Pagespeed API for mobile user-agents. You can identify and improve the ones which underperformed for Pagespeed Standards.
According to Addy Osmani:
- Speed Index should take place within 3 seconds,
- Time to Interactive 5 seconds,
- Largest Contentful paint 1 Second,
- First Input Delay within 130 MS.
Resource request size and resource load order are even more important to achieve these standards set for a $200 Android phone.

Using Chrome’s DevTools and no additional 3rd party tools to learn everything about your Resource Count/Size and WebPage Loading Event summaries. You can create a comparison for every web page for your website and your competitors thanks to Pagespeed API and Google Sheets with Automation and create some graphical insights for your developer teams.
For repeat visits, these upper limits are even stricter.
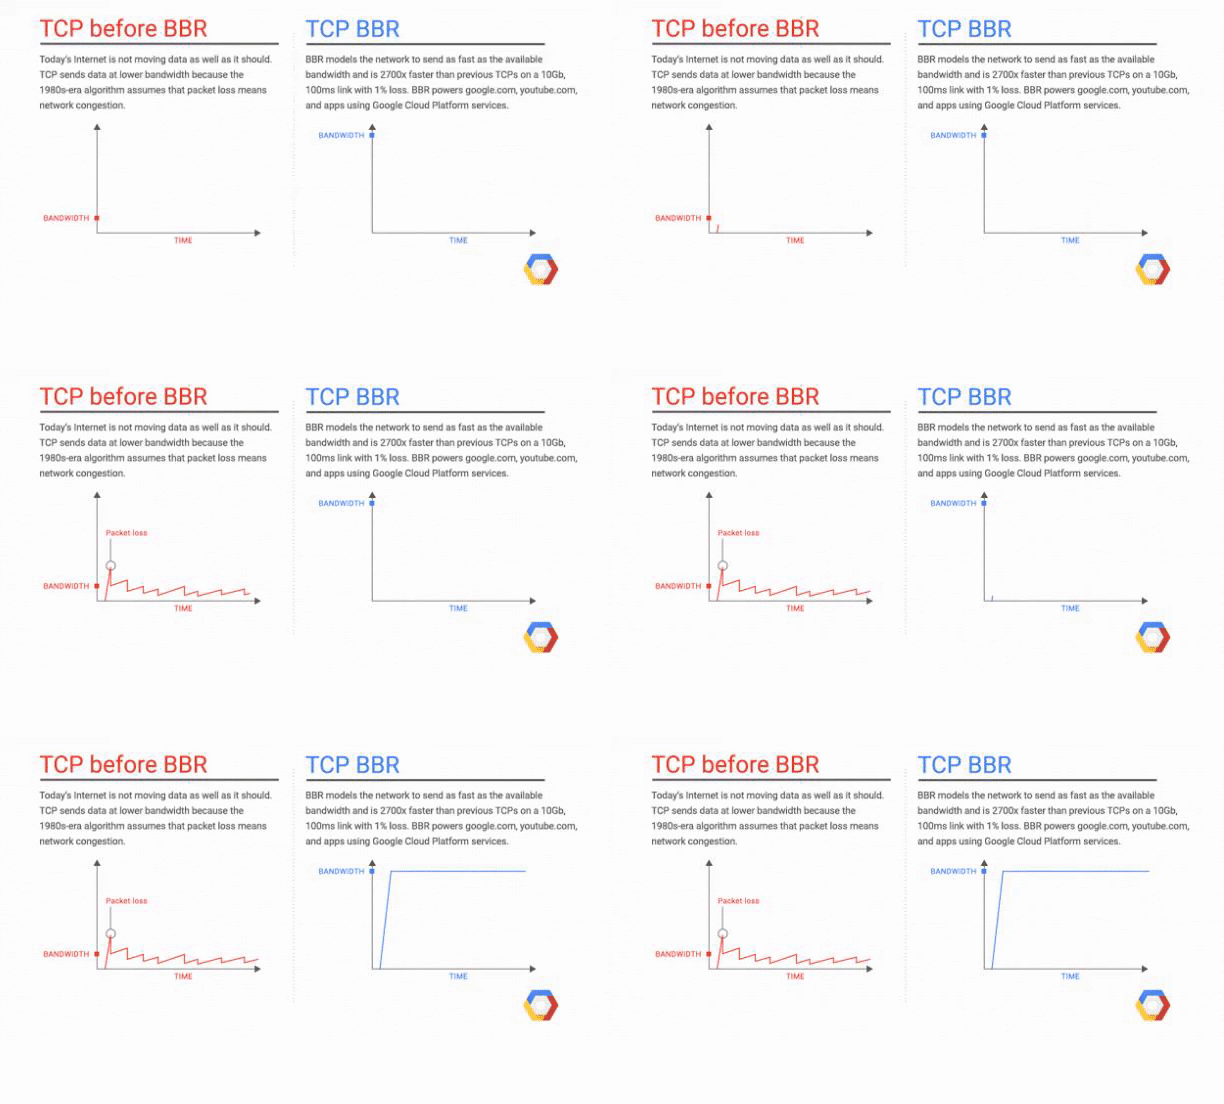
The resource you will load first and the resource you will put on the top is even more important due to the TCP Slow Start concept. TCP Slow Start marks the first part of the first 1460 bytes of the HTML file that can be delivered in 1.4 seconds.
In order to get rid of TCP Slow Start, Google has improved the TCP BBR (Bottleneck Bandwidth and Round-trip) technology especially for YouTube and achieved a 33% improvement in latency and round-trip times. Below you will see a representation from Google:
In this section, we’ll focus on a few different problematic issues related to resource count and resource request size.
Why talk about resource request size and count?
In terms of both page speed and crawl budget efficiency, request size and count are more important than resource load order.
You may increase your page load speed more by decreasing your request size than by modifying load order. You can modify request size by creating resource bundles and JavaScript chunks, and by preventing the loading of unnecessary/dead code.
If you upload every JS file for every category, you will create a heavy and unnecessary burden for your customers.
You can use Webpack which is created by Google or Babel to create JavaScript chunks. You can download only the necessary parts from JS bundles in this way. For more efficient JS chunk creation also you may also want to use Google’s Closure Compiler.
JavaScript Files associated with Third Party User Tracker-Ads
Third party tools contribute significantly to resource size and count issues, affecting speed, UX and crawl budget. All third party tools, including Google Tag Manager, Doubleclicks, Google Analytics, Yandex Metrica or Google AdSense, can cause users with slow internet connection and low- to mid-end phones. They are also responsible for UX problems, and may be a burden for search engines in terms of crawl budget.
You should not use your third party tools as a reason for render blocker while performing client side rendering, even for measurement and data collection purposes.
If you put third party tools before your important CSS and JS files, then your page speed, crawl budget and conversion rate will be negatively affected, and your page load time will increase, creating more load for both users and your server.

A screenshot from Google Canary and example test results
For this reason, Google has launched Publisher Ads Beta by placing Publisher Ads Tools in Chrome Canary. Thus, Google has taken the tool design to Chrome Updates, which will provide the necessary suggestions for both loading the advertising tags faster and preventing the advertising tags from getting ahead of the functional parts of the page.
Blocking unnecessary JS files for Googlebot to improve Crawl Budget
Though we’ve mostly been talking about optimization for users, you can also optimize resource loading for Googlebot.
When I asked John Mueller in a Google Webmaster Hangout If the blocking of ads via the robots.txt file is a problem, I got a clear “no” for an answer.
This means that if you are unable to remove all unnecessary resources for Googlebot from your website with methods such as dynamic rendering, you can block both your ads files and all your JS resources that run in a user-triggerable format via your robots.txt.
Googlebot doesn’t care about these resources unless it affects layout and content. Also, after blocking the ads, you can mark them with the tag in the semantic HTML if you want.
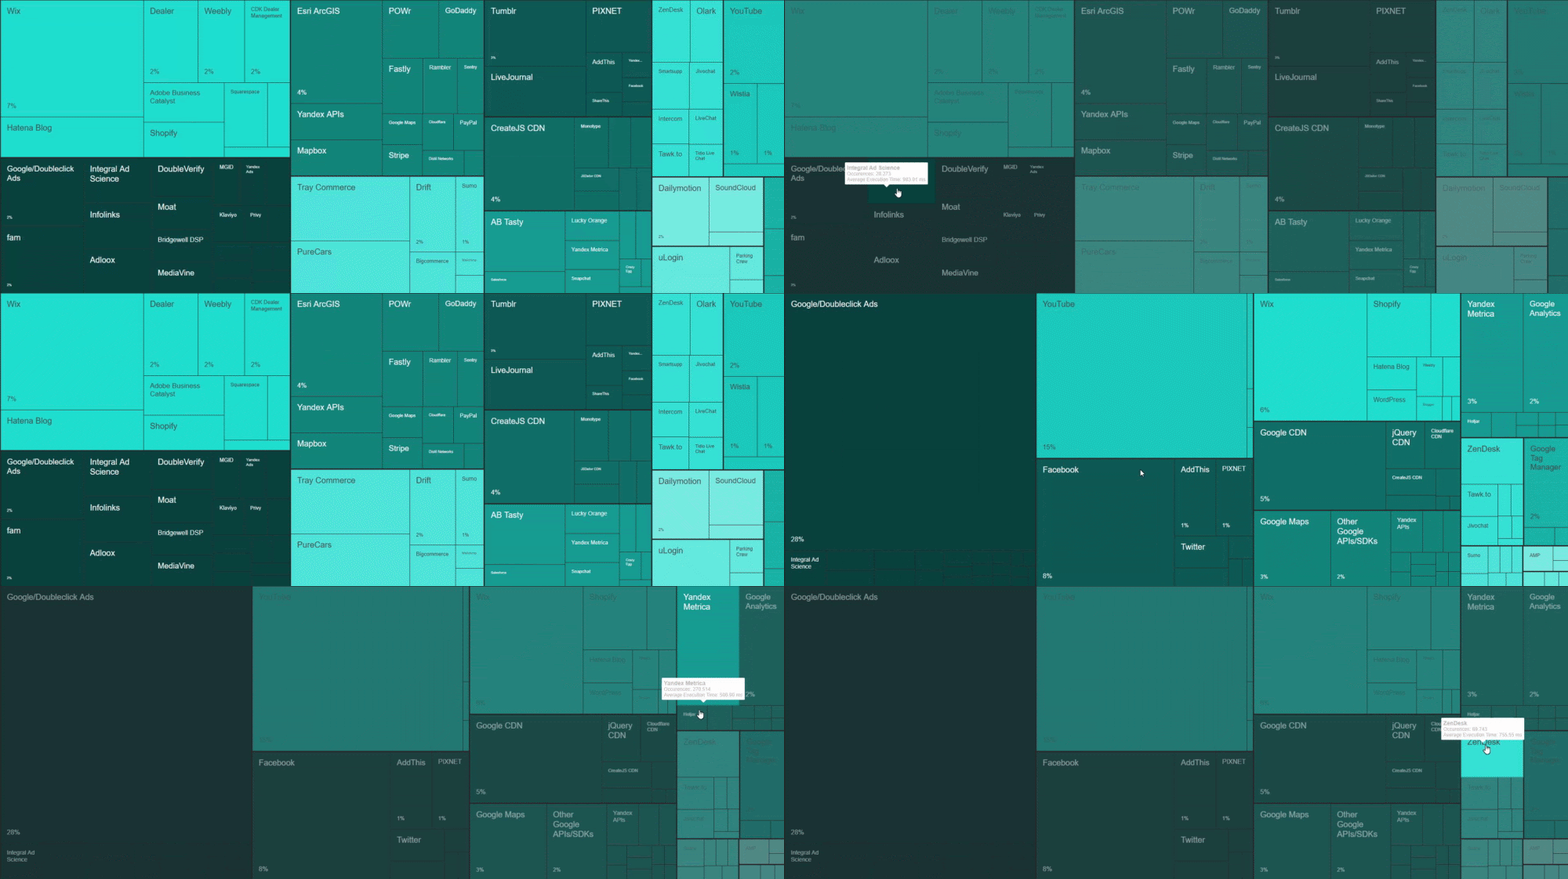
You can see the impact and cost of the third party JavaScript code in this diagram. Average cost and average impact are too high for Google/DoubleClick, YouTube, Facebook, Hotjar and other kinds of tracker/ads entities. To learn more: 3rd Web Today
Dynamic rendering is also another important topic. You can remove all third party JavaScript files, ads files and user-triggable JS files from your web pages along with unused CSS/JS code.
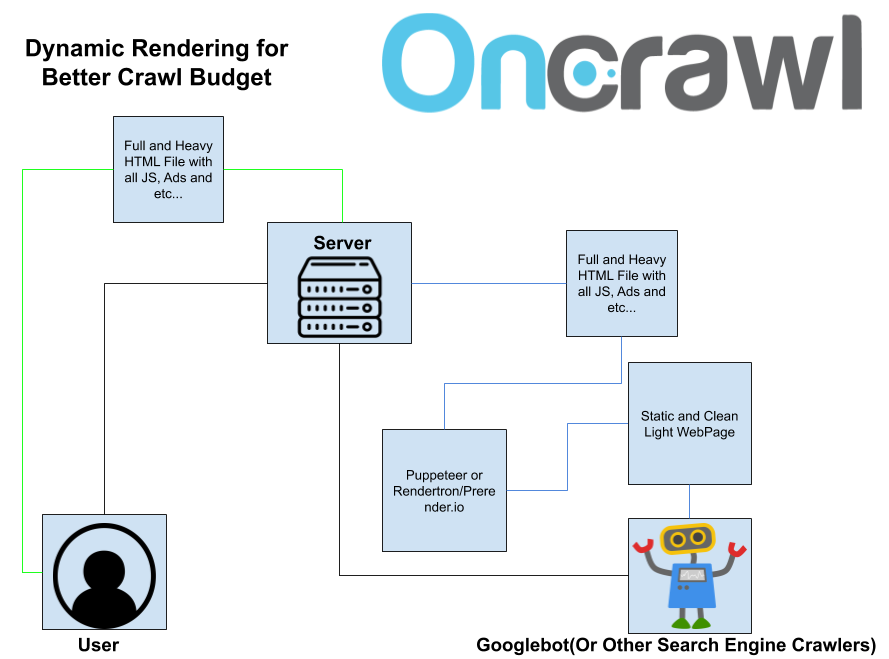
This is a dynamic rendering schema. The black lines are the requestor, yellow is for user responses, blue for crawler responses.
You can automate this with Rendertron or Puppeteer (You can practice here: https://codelabs.developers.google.com/codelabs/dynamic-rendering/#0) and serve this clean page for only search engine crawlers with dynamic serving. Most of the web sites will see an organic traffic increase between 15%-25% in one day with this kind of mix of different rendering methods, if they have huge crawl/rendering budget issues.
How speed affects UX… and crawl budget
The intersection of page speed with SEO/UX is a subject of web performance science.
Every human can notice one frame per every 16 MS. Every browser needs 6 MS for starting a new animation. So you need to create one frame for every 10 MS. If the web page is frozen for only 50 MS, people are noticing this but they don’t care; if it is 100 MS and more, they understand something is wrong. More than 300 MS, and they think their web page is not qualitative.
According to Google’s Web Behaviour experiments, people lose their focus after 2 seconds of waiting in an e-commerce site. If people wait more than 2 seconds on a web page for only a process, their stress increases as though they were in a real street fight.
For page speed, there are countless subtopics, such as Gzip, Deflate, Brotli differences or JavaScript conflicts, breakpoints, event listeners and event handlers, microservices, N-tier structures etc…

Quicker to download, more time/resource for crawling more.
The longer it takes for a user to load a page, the fewer pages they will visit. The same is true for Googlebot or other search engine crawlers. This affects both your crawl budget and the cost and intelligibility you create for search engines on your site, while reducing your conversion rate.

Try to watch a particular web page’s log files for Googlebot after you decrease its size and increase its speed. You will see a correlation between crawl frequency and keyword-ranking gain.
I’ll conclude this topic, which I believe I have worked with as broadly as possible in this series of articles, with a simple calculation of the crawl budget and conversion rate:
If you reduce the average load time of a website by just 200 MS, it means that Googlebot can complete its crawl request 200 MS earlier. If you are an e-commerce site with 2 million URLs and Googlebot makes a total of 1.5 million requests for your website each month, this will add up to savings of 300,000,000 MS. 300,000,000 MS equals 83,333,333 hours. This is 3,472 days.
In other words, you can significantly influence the browsing speed, indexing and SEO performance of your entire website with a theoretical calculation that you can perform for only 200 MS.
You can also discover the e-commerce conversion rate boost that 200 MS will create for you with linear regression formulas.

In SEO, you are racing with milliseconds. An example of a web page loading over a slow 3G connection,
Lastly, I am convinced that without reading code and being familiar with developer terms, we cannot create SEO miracles anymore. And, I think, in this year or the next one, knowing how to code in more than one language will be a default requirement for holistic SEO. And of course, I even cannot imagine an SEO profile without a holistic vision that includes an understanding of the different digital marketing fields. SEO is changing, SEOs will change with it.

