Most of us have experienced this at one time or another, you have a client or employer who has multiple public-facing websites. You’ve got this! Maybe you’ve had to manage duplicate content or implement cross-domain canonicals, but the job of SEO can still be fairly straightforward.
But then you’re expected to deliver a report. Now what? Take the same format you’d do for one site and duplicate it? How do you keep yourself from doing double the work every month? Or what if there are more than just two sites? How do you show how sites are performing in relation to one another?
Making an efficient reporting structure for companies with multiple websites takes planning. But with some effort up-front, you can save yourself a lot of time in the long run and make digesting reports a lot easier for your stakeholders. When we, at Transistor, have these situations, the end result is always a little different. Some companies have multiple websites covering completely unrelated brands. But most often, there’s some overlap in products/services or audience. For those cases, we’ve developed a few habits that can make the process more efficient. Here are the most common tricks we start with.
Set your dashboard up for success
We use Google Data Studio for our reporting. If you’re on some other platform for building dashboards, the functionality may not be the same, but you should be able to take the concepts here and apply them to your own toolset.
- Pages for each site (GA, GSC, Ranking)
This might be the most straightforward piece here, but it’s crucial. Generally when there’s multiple websites there are folks throughout the company who only care about one of the sites (brand managers, among others). Make it easy for them to look at only the data they care about. - Unified pages
Some parts of your job will apply to every site. Two common examples that we’ll cover later are keyword targeting and technical implementation. Where it makes sense to combine these things in a single page, do so! - Report level elements
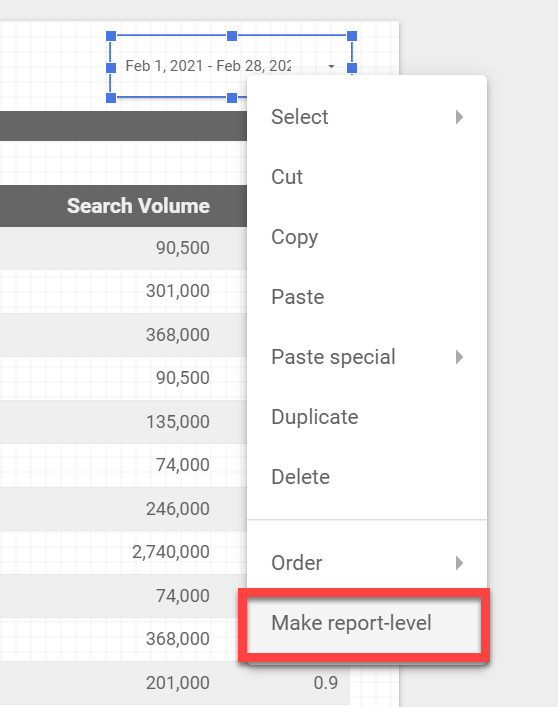
Did you know you can right click things in GDS and make them appear/function across the entire report? This is incredibly useful for date range selections (e.g. if someone wants to see month-to-date numbers, you don’t want them to have to change the date range on every page they review). But it also makes formatting your reports easier when you’re adding things like logos or header areas.

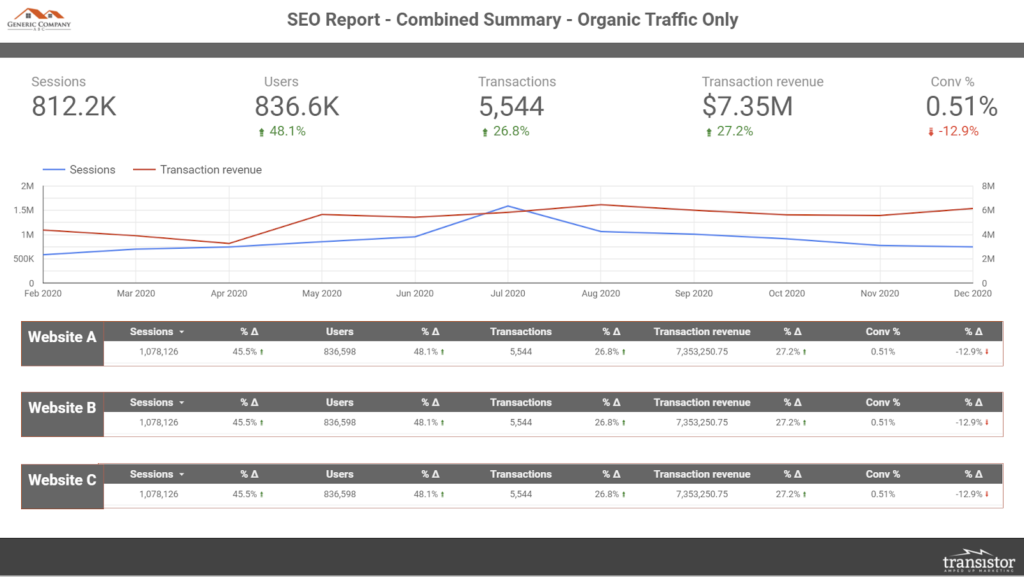
- For execs, summary view with blended data
You’ll almost always have a group of people who want an executive summary that shows company-wide performance. In these cases, blended data is the way to go. We also recommend breaking out those same data points by brand/site on the same page.

- Google sheets for notes – site specific or use a “website” column
We see a lot of people use text boxes within their dashboard for notes/observations. That’s easy, but you lose any historical record. We always use Google Sheets. Simply adding a date column to your sheet means that you can only display the notes for the current reporting period, but have the ability to go back to any time period and see the relevant notes.For multiple sites, you have to adjust your approach based on the company. Usually a single page in the report to display notes and a column/filter for which website(s) the note applies to is the easiest route. But at times, we have people who only want to see notes for the site they care about and we have to do multiple pages. - Where the notes go depends on how you deliver reports
This applies to all reporting, but if you have a lot of people looking at the reports independently (where you’re not talking them through it), it might help to have notes be the first page of the dashboard. Set the tone before they start obsessing over the numbers. If you’re talking people through the data, you can push the notes to the last page.
[Case Study] Handling multiple site audits
Map your targeting at the company-level
This may be a basic part of your optimization strategy, but it’s helpful to bring up here because it can also apply to reporting. When deciding which topics/keywords you’re going to focus on and track, there are a couple questions that need to be answered when multiple websites are involved.
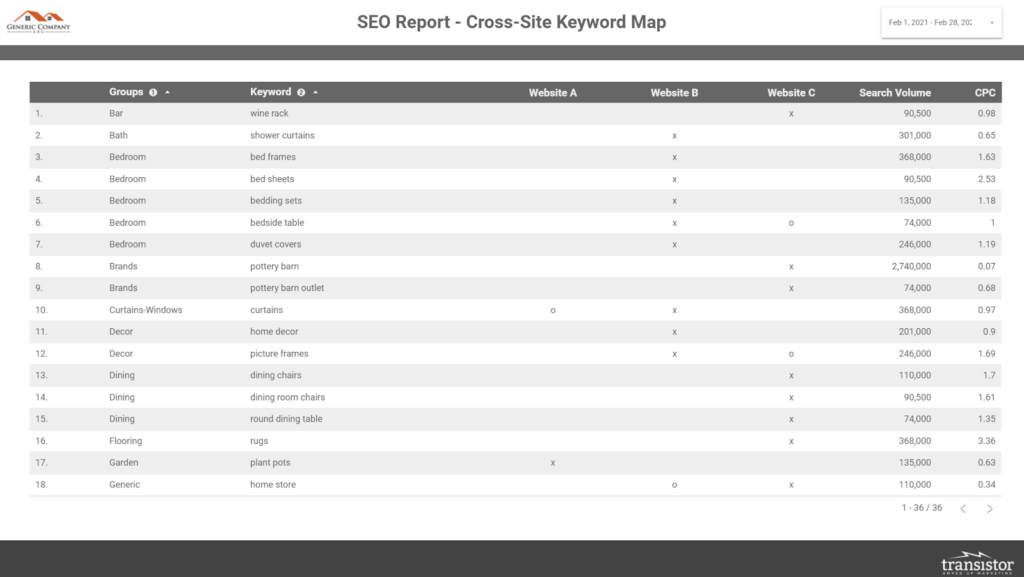
- Determine which keywords relate to which site
Again, we are thinking of the most common scenarios where there is some amount of overlap across brands/sites. For the high-level keywords that don’t overlap, a simple chart to determine which term relates to which brand is a basic exercise in managing your SEO strategy. - Assign priorities where overlap exists
So let’s say two of your websites sell bed sheets. Only one site can rank first. Which one should it be? We’ll usually have some simple designation for which site is the top priority for a given term vs the lower priority site. - Bring it into reporting
This is helpful for anyone you work with that is heavily invested in SEO as well as those folks who might see a site ranking and wonder why it’s not another site. If you’re using something like Google Data Studio for reporting, the easiest way to accomplish this is by connecting a spreadsheet.

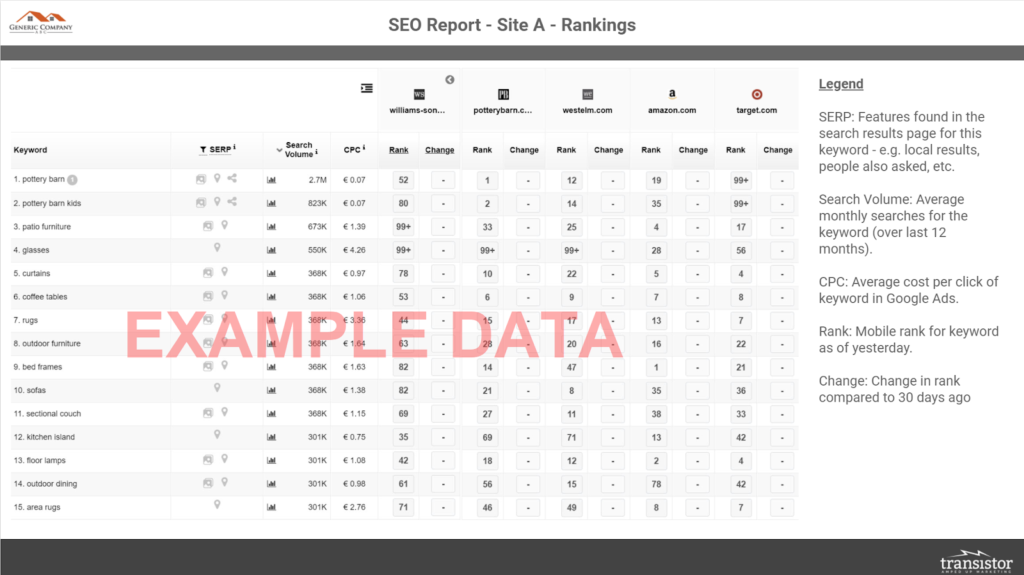
Bring each site into your rank tracking
So we discussed overlaps in targeting keywords across multiple sites, what about tracking?
The easiest way to accomplish this is by adding each site as a competitor within your rank tracking tool. Some rank trackers are fancy enough to let you assign competitors at the segment/group level (meaning, a subset of your keywords). But as long as there’s a fair amount of overlap in targeting across two or more sites, it makes sense to add them as a competitor.
We do this across each site. So in rank tracking for Site A, Sites B & C are competitors. For Site B, Sites A & C are competitors. And so on. This allows us to focus in on the performance of each site individually, but also track where our other sites are fitting in as well as quickly identify cannibalization issues across brands.

Simplify your technical review
One great thing about companies with multiple websites is that they’ll often use the same technology across each site. This means we can get super efficient with our technical review and implementation, as something we do on one site often applies to the others.
Have a unified technical implementation table. If you’ve got a project management tool that everyone is using, maybe this is redundant. But if you don’t, definitely include all your technical requests in your reporting. This is just another way to simplify your workflow by limiting the number of documents everyone has to remember.

Closing thoughts
When taking this approach to reporting, you might feel like the final dashboard is massive. But, it’s a single dashboard! By consolidating some of your pages, the net result is fewer total pieces to your reporting. Even more important, having data for each website in one place allows you to work more efficiently and quickly identify performance issues vs having to flip through multiple disconnected reports.
Another benefit to putting in some of this additional work up front is that you’ll have a lot of pieces in place to more easily expand on reporting later. If a stakeholder wants you to add some additional metrics, you’ll already have the connections and blended data built out to where changes are much easier.
Now go forward and make reporting less stressful!


