One of my favorite slide decks from the last ten years was done by Mark Johnstone in 2014, while he was still with Distilled. The deck was called How to Produce Better Content Ideas and I used it as my bible for a few years while building teams to do the hard work of content promotion.
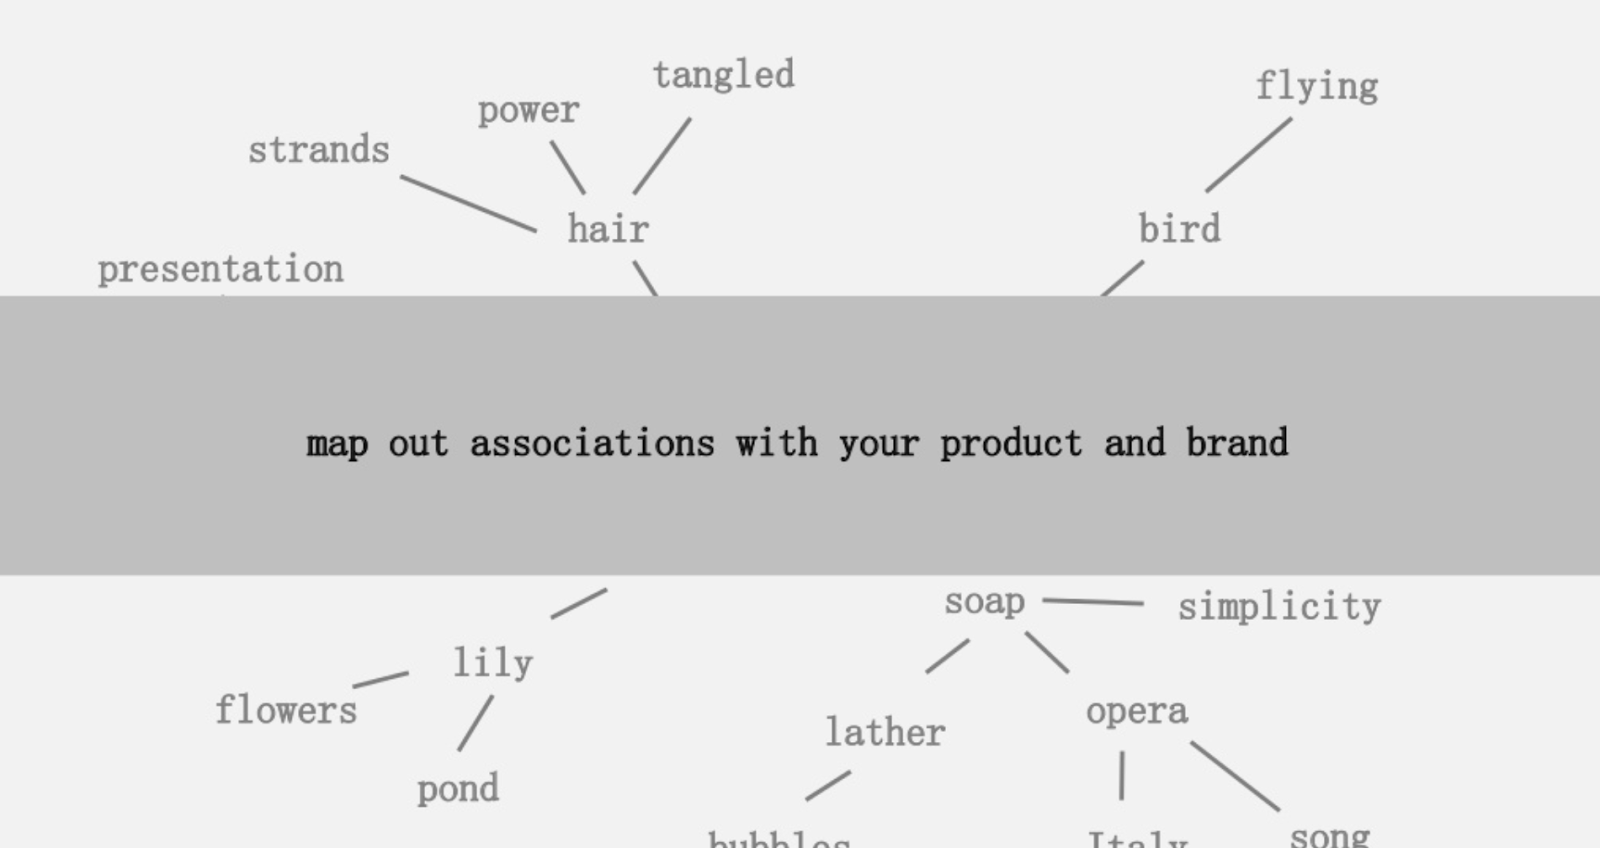
One of the ideas offered was to create a visual mapping of the connectedness of words associated with your product or brand so that you can stand back, and look for ways to combine the associations into something interesting. The goal being the production of ideas, which he defines as “a novel combination of previously unconnected elements in a way that adds value.”
In this article, we take a take a far more left-brain approach, by using Python, Google’s Language API, along with Wikipedia, to explore entity associations that exist from a seed topic. The goal being a high level view of entity relationships along the topic graph. This article is not for the average reader. Readers who are familiar with Python and have at least a basic level of coding ability will find it much more instructive.
The Idea
Following up Mark Johnstone’s mapping idea, I thought it would be interesting to let Google and Wikipedia define a topic structure starting from a seed topic or webpage. The goal is to build out the mapping of relationships to the main topic visually, in a tree-like graph that can be reviewed to look for connections and possibly generate content ideas. The following image represents the initial design idea.
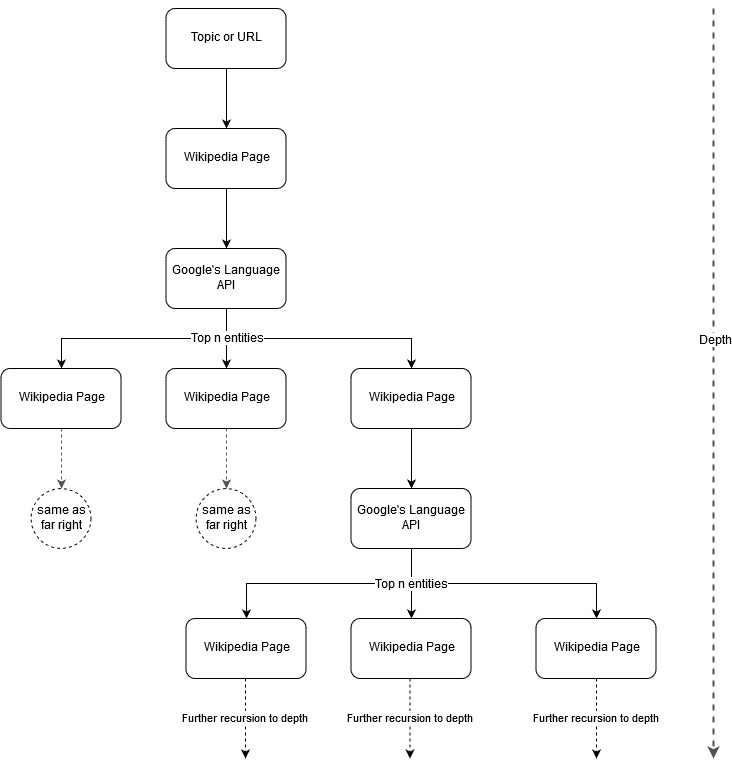
Essentially, we give the tool a topic or URL, and let Google’s Language API select the top n (3 in our examples) entities (that include Wikipedia URLs) for each entity page and we recursively keep building out a network graph for each found entity up to a maximum depth.
Background of Tools Used
Google Language API
Google’s Language API allows you to pass it either plain text or HTML and it magically returns all the various entities associated with the content. The API does more than this, but for this analysis, we will focus only on this portion. Here is a list of the types of entities it returns:

Entity identification has been a fundamental part of Natural Language Processing (NLP) for a long time and the correct terminology for the task is Named Entity Recognition (NER). NER is a difficult task because many words have different meanings based on the context used so NLP tools or APIs have to understand the full context surrounding terms to be able to properly identify them as a particular entity.
I gave a pretty detailed overview of this API, and entities in particular, in an article on opensource.com if you want to catch up on some context prior to finishing this article.
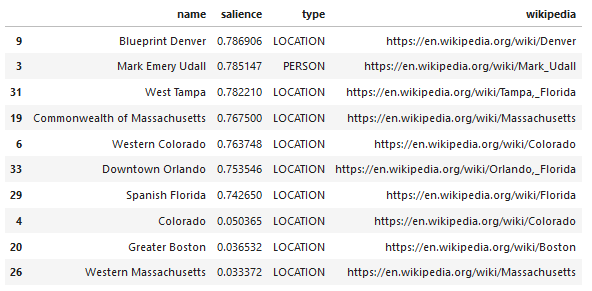
One interesting feature of Google’s Language API is, in addition to finding relevant entities, it also marks how related they are to the overall document (salience), and, for some, supplies a related Wikipedia (knowledge graph) article representing the entity.
Here is a sample output of what the API returns (sorted by salience):
Oncrawl API
Python
Python is a software language that has become popular in the data science space due to a large, and growing, set of libraries that make it easy to ingest, clean, manipulate, and analyze large datasets. It also benefits from a collaborative environment called Jupyter notebooks which allow users to easily test and annotate their code in an effortless way.
For this review, we will be using a few key libraries which will allow us to do some interesting things with Google’s NLP data.
- Pandas: Think of being able to script Microsoft Excel to read, save, parse, or rearrange spreadsheets and you get an idea of what Pandas does. Pandas is amazing. (link)
- Networkx: Networkx is a tool for constructing graphs of nodes and edges that define the relationships between the nodes. It also has inbuilt support for plotting the graphs so they are easy to visualize. (link)
- Pywikibot: Pywikibot is a library that allows you to interact with Wikipedia to search, edit, find relationships, etc., with all the content for each Wikipedia site. (link)
The Process
We are sharing a Google Colab notebook here that can be used to follow along. (Special thanks to Tyler Reardon for a sanity check on the article and this notebook.)
Setting up
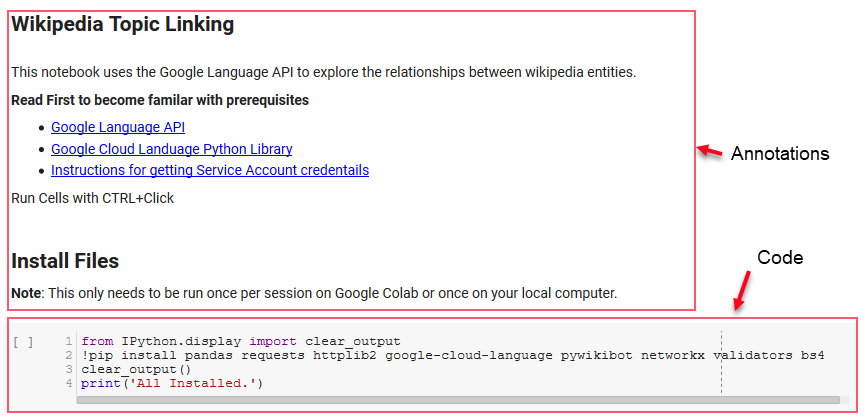
The first few cells in the notebook deal with installing some libraries, making those libraries available to Python, and providing a credentials and config file for Google’s Language API and Pywikibot, respectively. Here are all the libraries we need to install to ensure the tool can run:
- pandas
- requests
- httplib2
- google-cloud-language
- pywikibot
- networkx
- validators
- Bs4
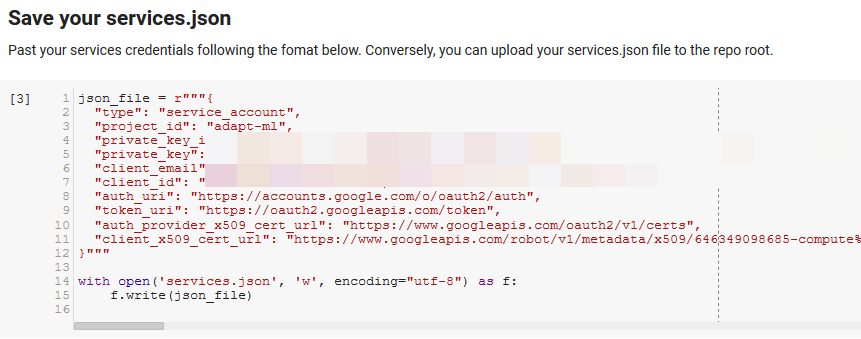
Note: The hardest part of being able to run this notebook is obtaining credentials from Google to access their APIs. For those inexperienced with this, this will take an hour or so to figure out. We linked the Instructions for getting Service Account credentials at the top of the notebook to help you out. Below is an example of how we included ours.
Functions for the Win
In the cell indicated by “Define some functions for Google NLP,” we develop eight functions that handle things like querying the Language API, interacting with Wikipedia, extracting web page text, and building and plotting graphs. Functions are essentially small units of code that take in some settings data, do some work, and produce something. All of the functions are commented to tell the variables that they take in, and what they produce.
Testing the API
The following two cells take a URL, extract the text from the URL, and pull the entities from Google’s Language API. One pulls only entities that have Wikipedia URLs and the other pulls all entities from that page.
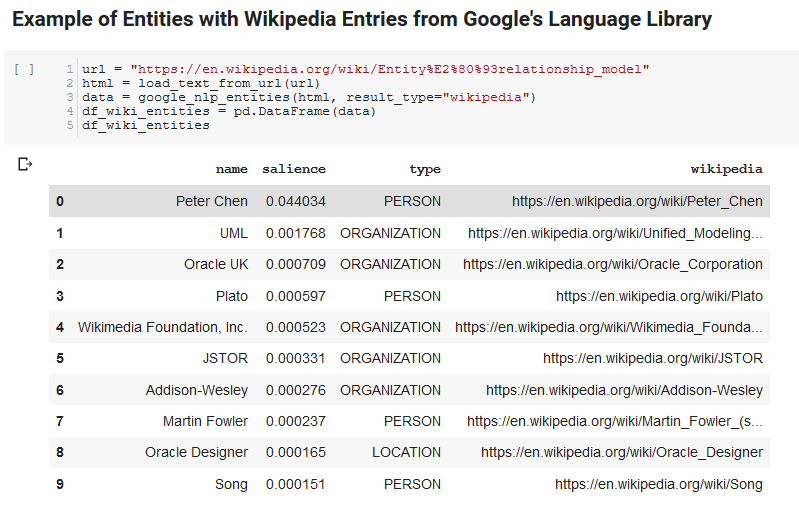
This was an important first step just to get the content extraction portion correct and understanding how the Language API worked and returned data.
Networkx
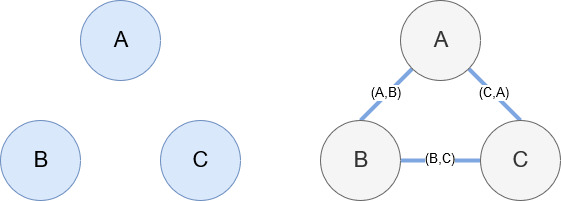
Networkx, as mentioned earlier, is a wonderful library that is fairly intuitive to play with. Essentially, you have to tell it what your nodes are and how the nodes are connected. For example, in the image below, we give Networkx three nodes (A,B,C). We then tell Networkx that they are connected by edges (A,B), (B,C), (C,A) defining the relationships between the nodes. For our usage, the entities with Wikipedia URLs will be the nodes and the edges are defined by new entities being found on a current entity page. So, if we are reviewing the Wikipedia page for Entity A, and on that page, Entity B is discovered, then that is an edge between Entity A and Entity B.
Putting it all Together
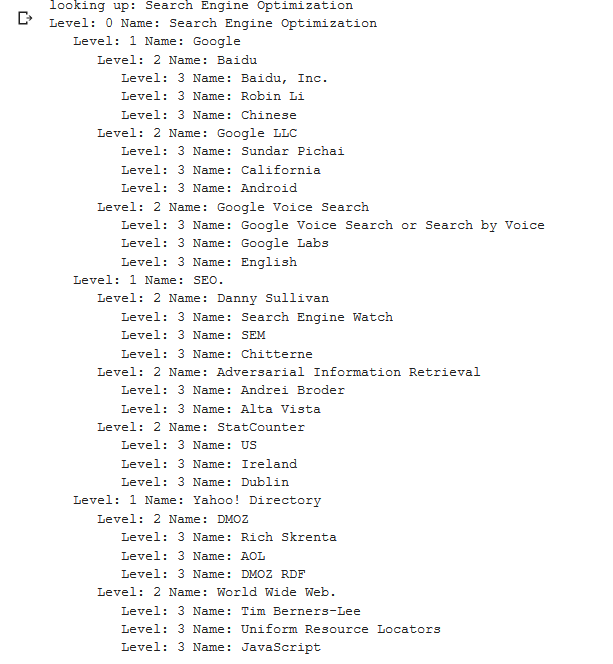
The next section of the notebook is called Wikipedia Topic Branching by URL. This is where the magic happens. We had defined a special function (recurse_entities) earlier that recurses through pages on Wikipedia following new entities defined by Google’s language API. We also added a really awkward-to-understand function (hierarchy_pos) that we lifted from Stack Overflow that does a good job of presenting a tree-like graph with many nodes. In the cell below, we define the input as “Search Engine Optimization” and specify a depth of 3 (this is how many pages it follows recursively), and a limit of 3 (this is how many entities it pulls per page).

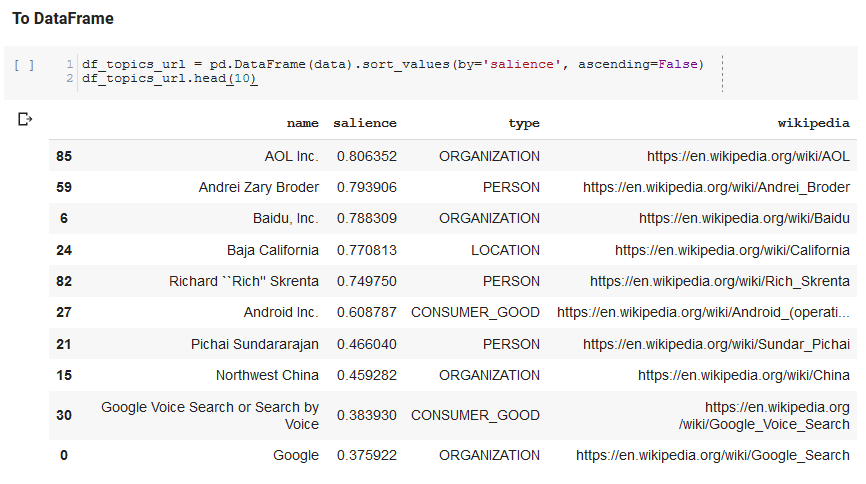
Running it for the term “Search Engine Optimization” we can see the following path the tool took, starting at Wikipedia’s Search Engine Optimization page (Level 0) and following, recursively, the pages up to the max depth specified (3).
We then take all the found entities and add them to a Pandas DataFrame, which makes it really easy to save as a CSV. We sort this data by salience (which is how important the entity is to the page it was found on), but this score is a bit misleading in this context because it does not tell you how related the entity is to your original term (“Search Engine Optimization”). We will leave that further work to the reader.
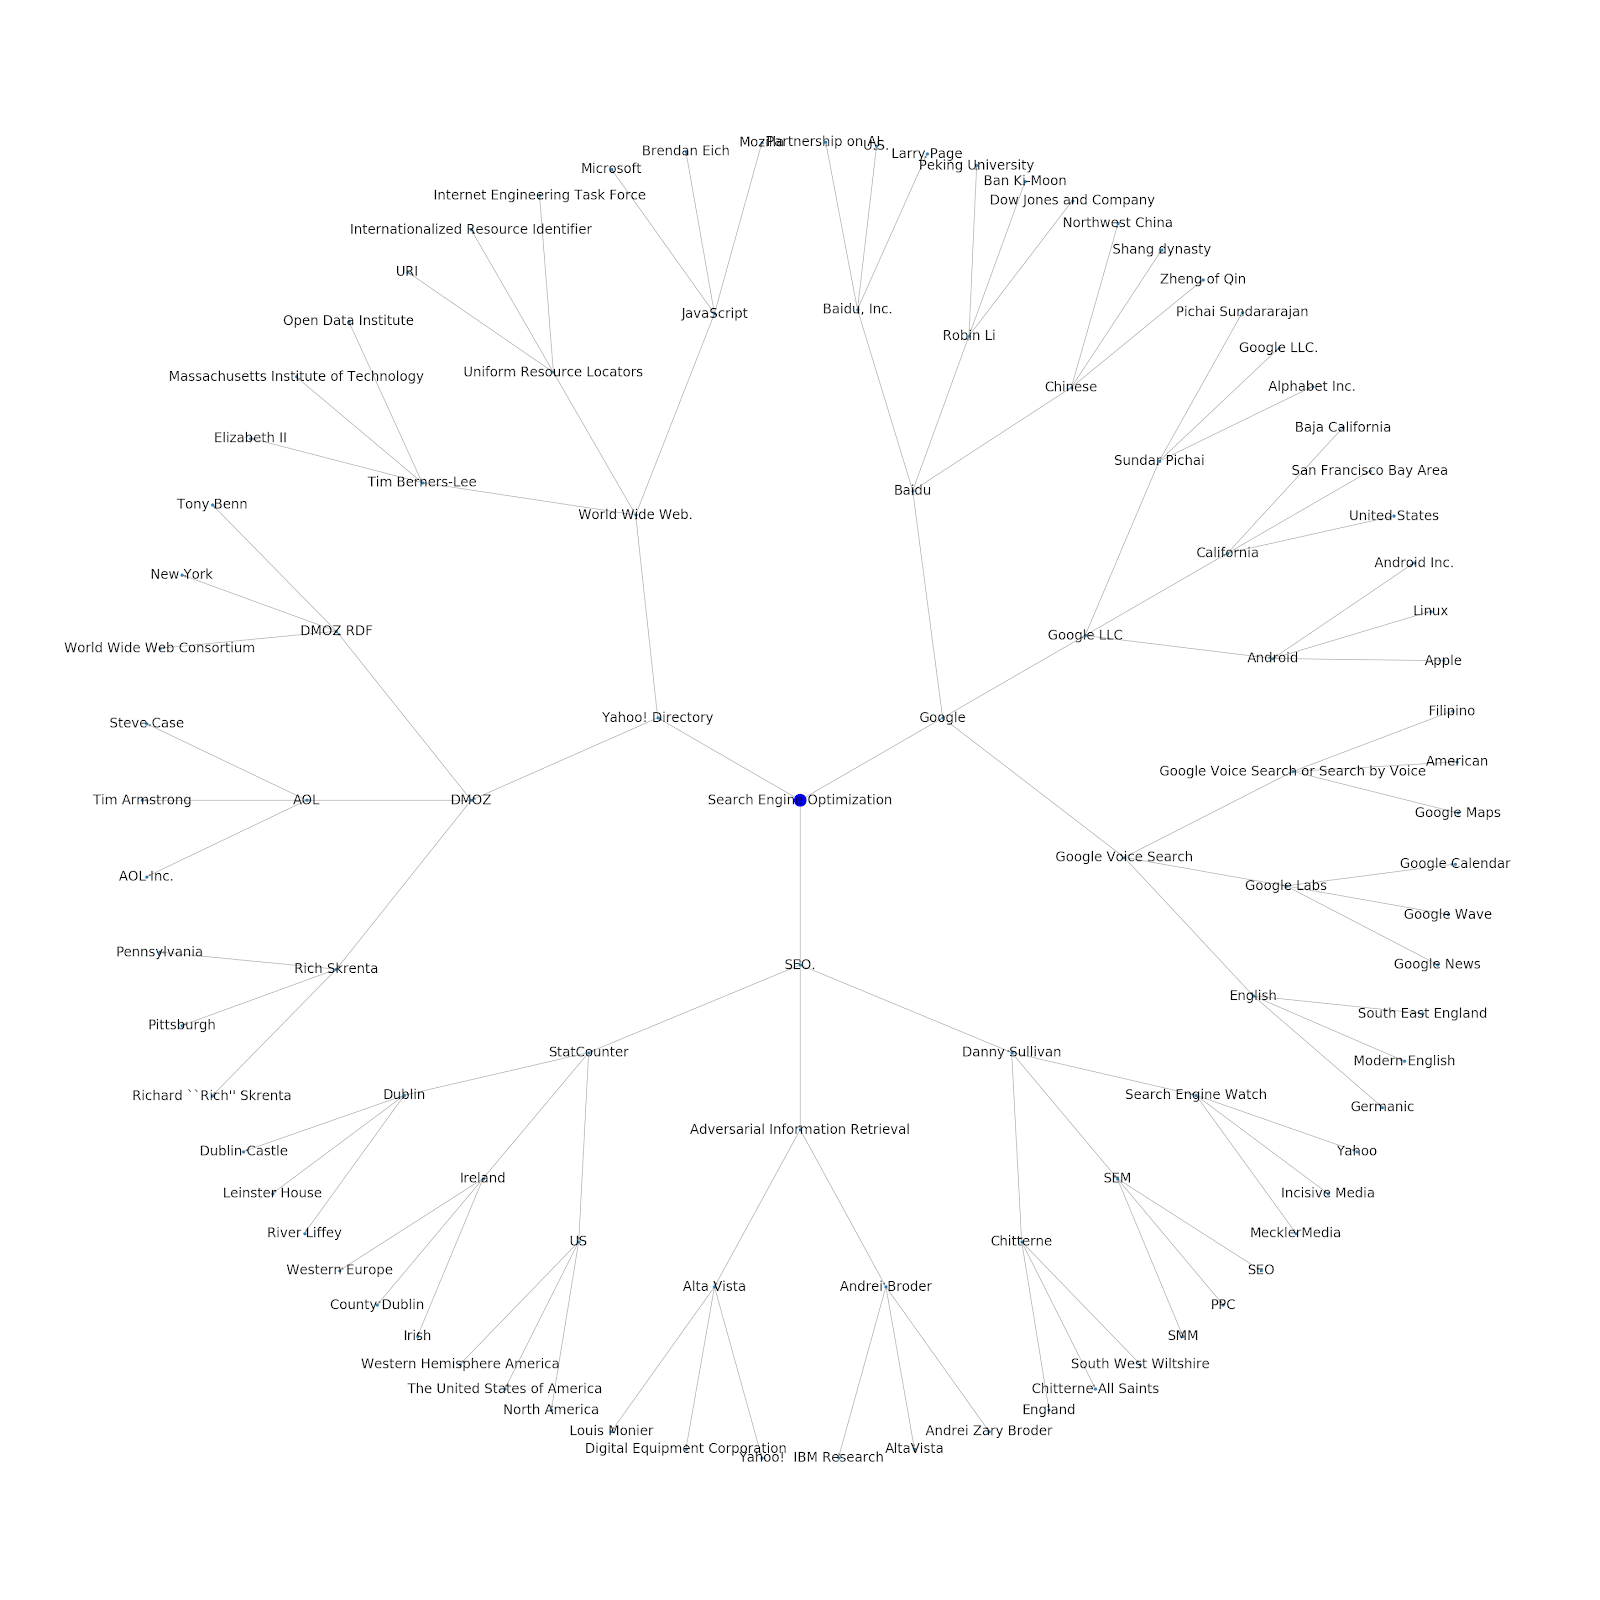
Finally, we plot the graph built by the tool to show the connectedness of all the entities. In the cell below, the parameters you can pass to the function are: (G: the Graph built prior by the recurse_entities function, w: the width of the plot, h: the height of the plot, c: the percent circular of the plot, and filename: the PNG file that is saved to the images folder.)

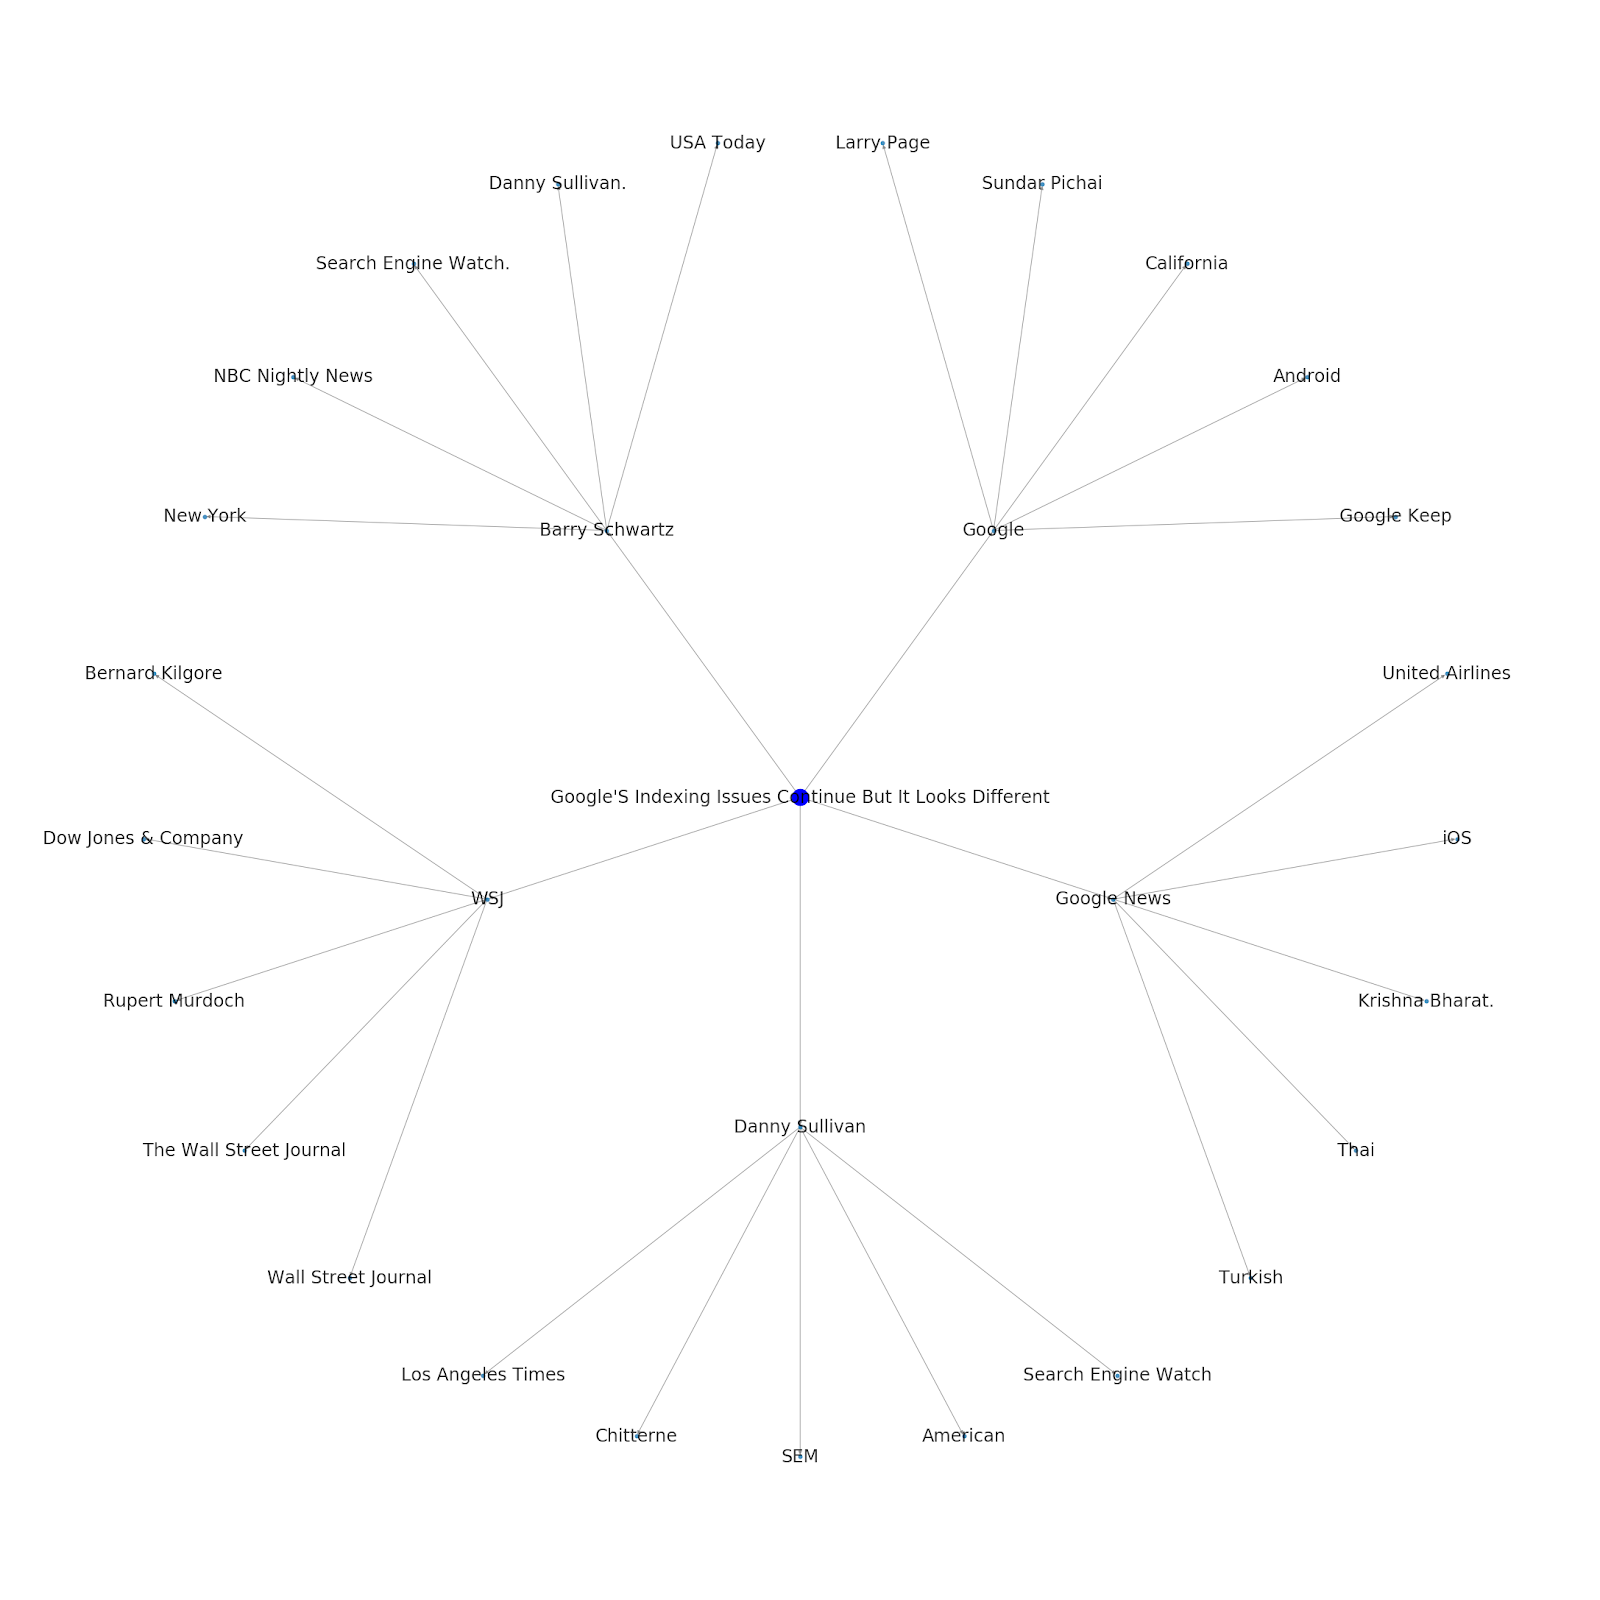
We added the ability to either give it a seed topic or a seed URL. In this case, we look at the entities associated with the article Google’s Indexing Issues Continue But This One Is Different
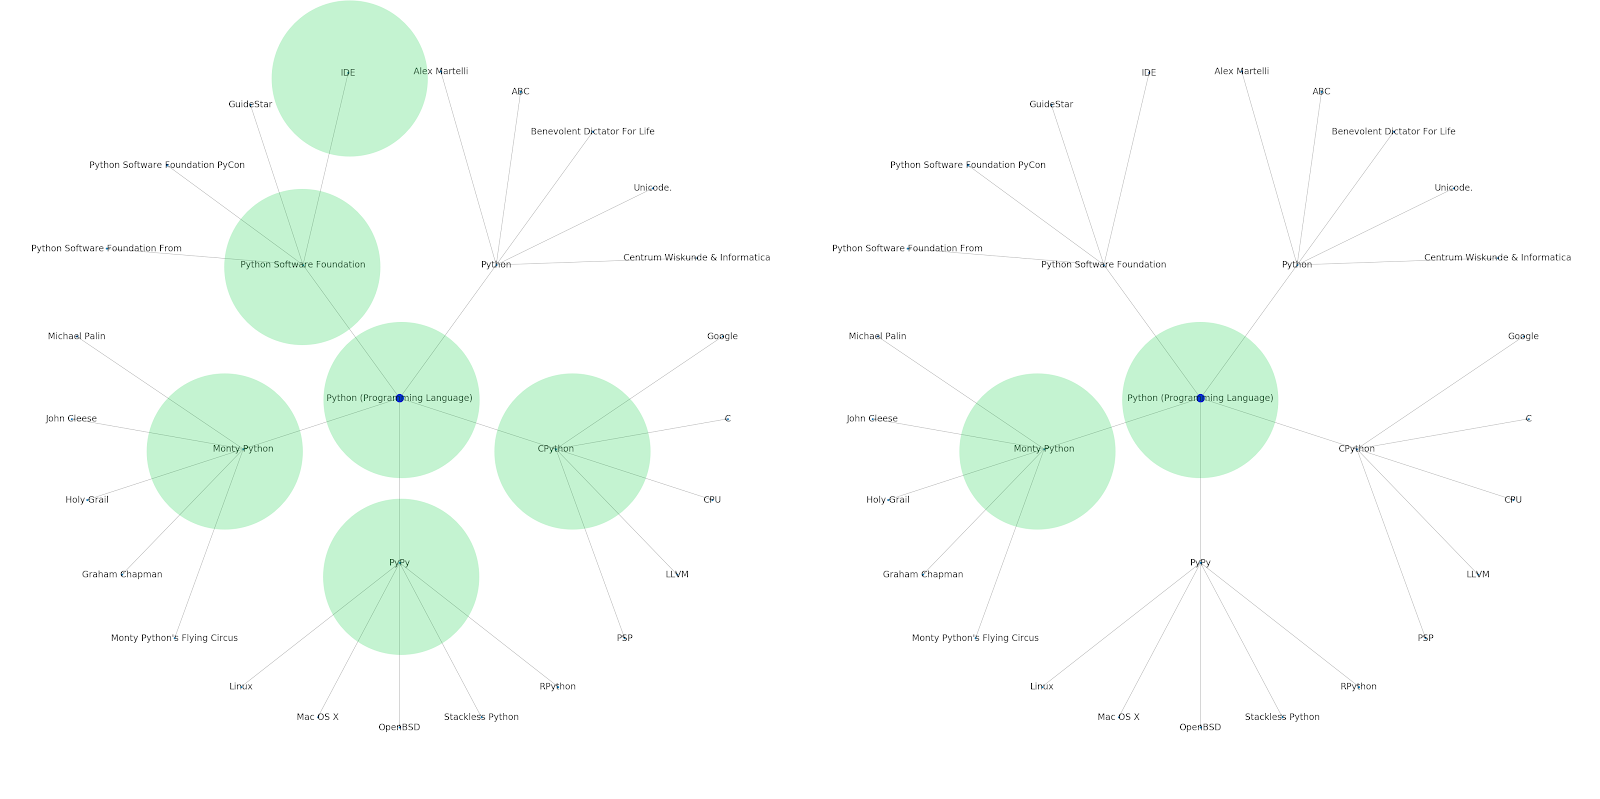
Here is the Google/Wikipedia entity graph for Python.

What This Means
Understanding the topic layer of the internet is interesting from an SEO standpoint because it forces you to think in terms of how things are connected and not solely on individual queries. Since Google is using this layer to match individual user affinities to topics, as mentioned in their Google Discover reintroduction, it may become a more important workflow for data-focused SEOs. In the “Python” graph above, it may be inferred that a user’s familiarity with the topics related to a seed topic may be a reasonable gauge of their level of expertise with the seed topic.
The example below shows two users with the green highlights showing their historical interest or affinity with related topics. The user on the left, understanding what an IDE is, and understanding what PyPy and CPython mean, would be a much more experienced user with Python, than someone who knows it is a language, but not much else. This would be easy to turn into numerical scores for each topic, for each user.
Conclusion
My goal today was to share what is a pretty standard process I go through to test and review the effectiveness of various tools or APIs using Jupyter Notebooks. Exploring the topic graph is incredibly interesting and we hope you find the tools shared give you the head start you need to begin exploring for yourself. With these tools you are able to build topic graphs that explore many relationship levels, only limited to the extent of Google’s Language API’s quota (which is 800,000 per day). (Update: The pricing is based on units of 1,000 unicode characters sent to the API and is free up to 5k units. Since Wikipedia articles can get long, you want to watch your spend. Hat tip to John Murch for pointing this out.) If you enhance the notebook or find interesting cases, I hope you will let me know. You can find me at @jroakes on Twitter.
